
Bitcoin surpasses $95, tests $96.500 and maintains positive technical bias.

- Bitcoin consolidates above $95 with volume.
- Moving averages support upward trend in the short term.
- Technical resistance levels are emerging between US$100 and US$110.
Tuesday, January 13, 2026 – Bitcoin regained traction in this session, reaching a high near $96.500 before slowing down and stabilizing above $95.000. The move extended gains after several days of consolidation above the psychological level of $90.000, reinforcing the view that the market has returned to accepting higher prices in the short term.
The advance was accompanied by an increase in trading volume, a signal closely watched by investors. This behavior indicates broader participation, ruling out the idea that the rise was caused by low liquidity or isolated movements. In the current environment, the interaction between volume and price has become one of the main indicators for assessing the consistency of the movement.
From a technical standpoint, the $95.000 level is back at the center of analysis. After acting as resistance in previous attempts at appreciation, the region has begun to function as potential support. This change alters the short-term structure and redefines the reference points used by traders who follow daily and intraday charts.
On TradingView, the breakout from the consolidation range occurred with a clear directional candle, supported by increasing volume. Analysts highlight that the breakout was organized, without signs of stress in the order flow. The prevailing interpretation is that available liquidity has been sufficient to absorb demand, preventing disorderly movements.
Technical analysis was also reinforced by the analysis of trader Michaël van de Poppe, who pointed to the maintenance of the 21-day moving average as one of the main factors supporting the price. According to him, Bitcoin has made multiple tests of this average, which has remained as support, while the chart has consistently registered higher highs and higher lows. In his assessment, this structure opens up space for a continuation of the movement in the coming sessions.
In the charts shared by the analyst, three technical zones stand out as relevant resistances: US$100.000, US$105.000, and US$110.000. These levels will be monitored by the market as the price remains above US$95, serving as potential targets should the buying flow remain active.
There we go.# Bitcoin breaks upwards.
✅ Holds the 21-Day MA.
✅ Multiple tests of that moving average held as support.
✅ Makes constant higher lows higher highs.It's quite clear that this is going to run to $100K in the next week and that dips are for buying.
The bull… pic.twitter.com/r7dw2K29kT
- Michaël van de Poppe (@CryptoMichNL) January 13, 2026
With Bitcoin once again in the spotlight, investors are closely monitoring daily closing prices, trading flows, and price response in key regions. Consolidation above $95.000 represents a significant shift in short-term technical analysis, establishing a new trading range for future movements.
Disclaimer: The content of this article solely reflects the author's opinion and does not represent the platform in any capacity. This article is not intended to serve as a reference for making investment decisions.
You may also like
Senior Investor Dan Tapiero: Bitcoin Will Rise to $180,000 This Cycle
China tech stocks outperform global peers on self‑sufficiency story despite slow economic growth
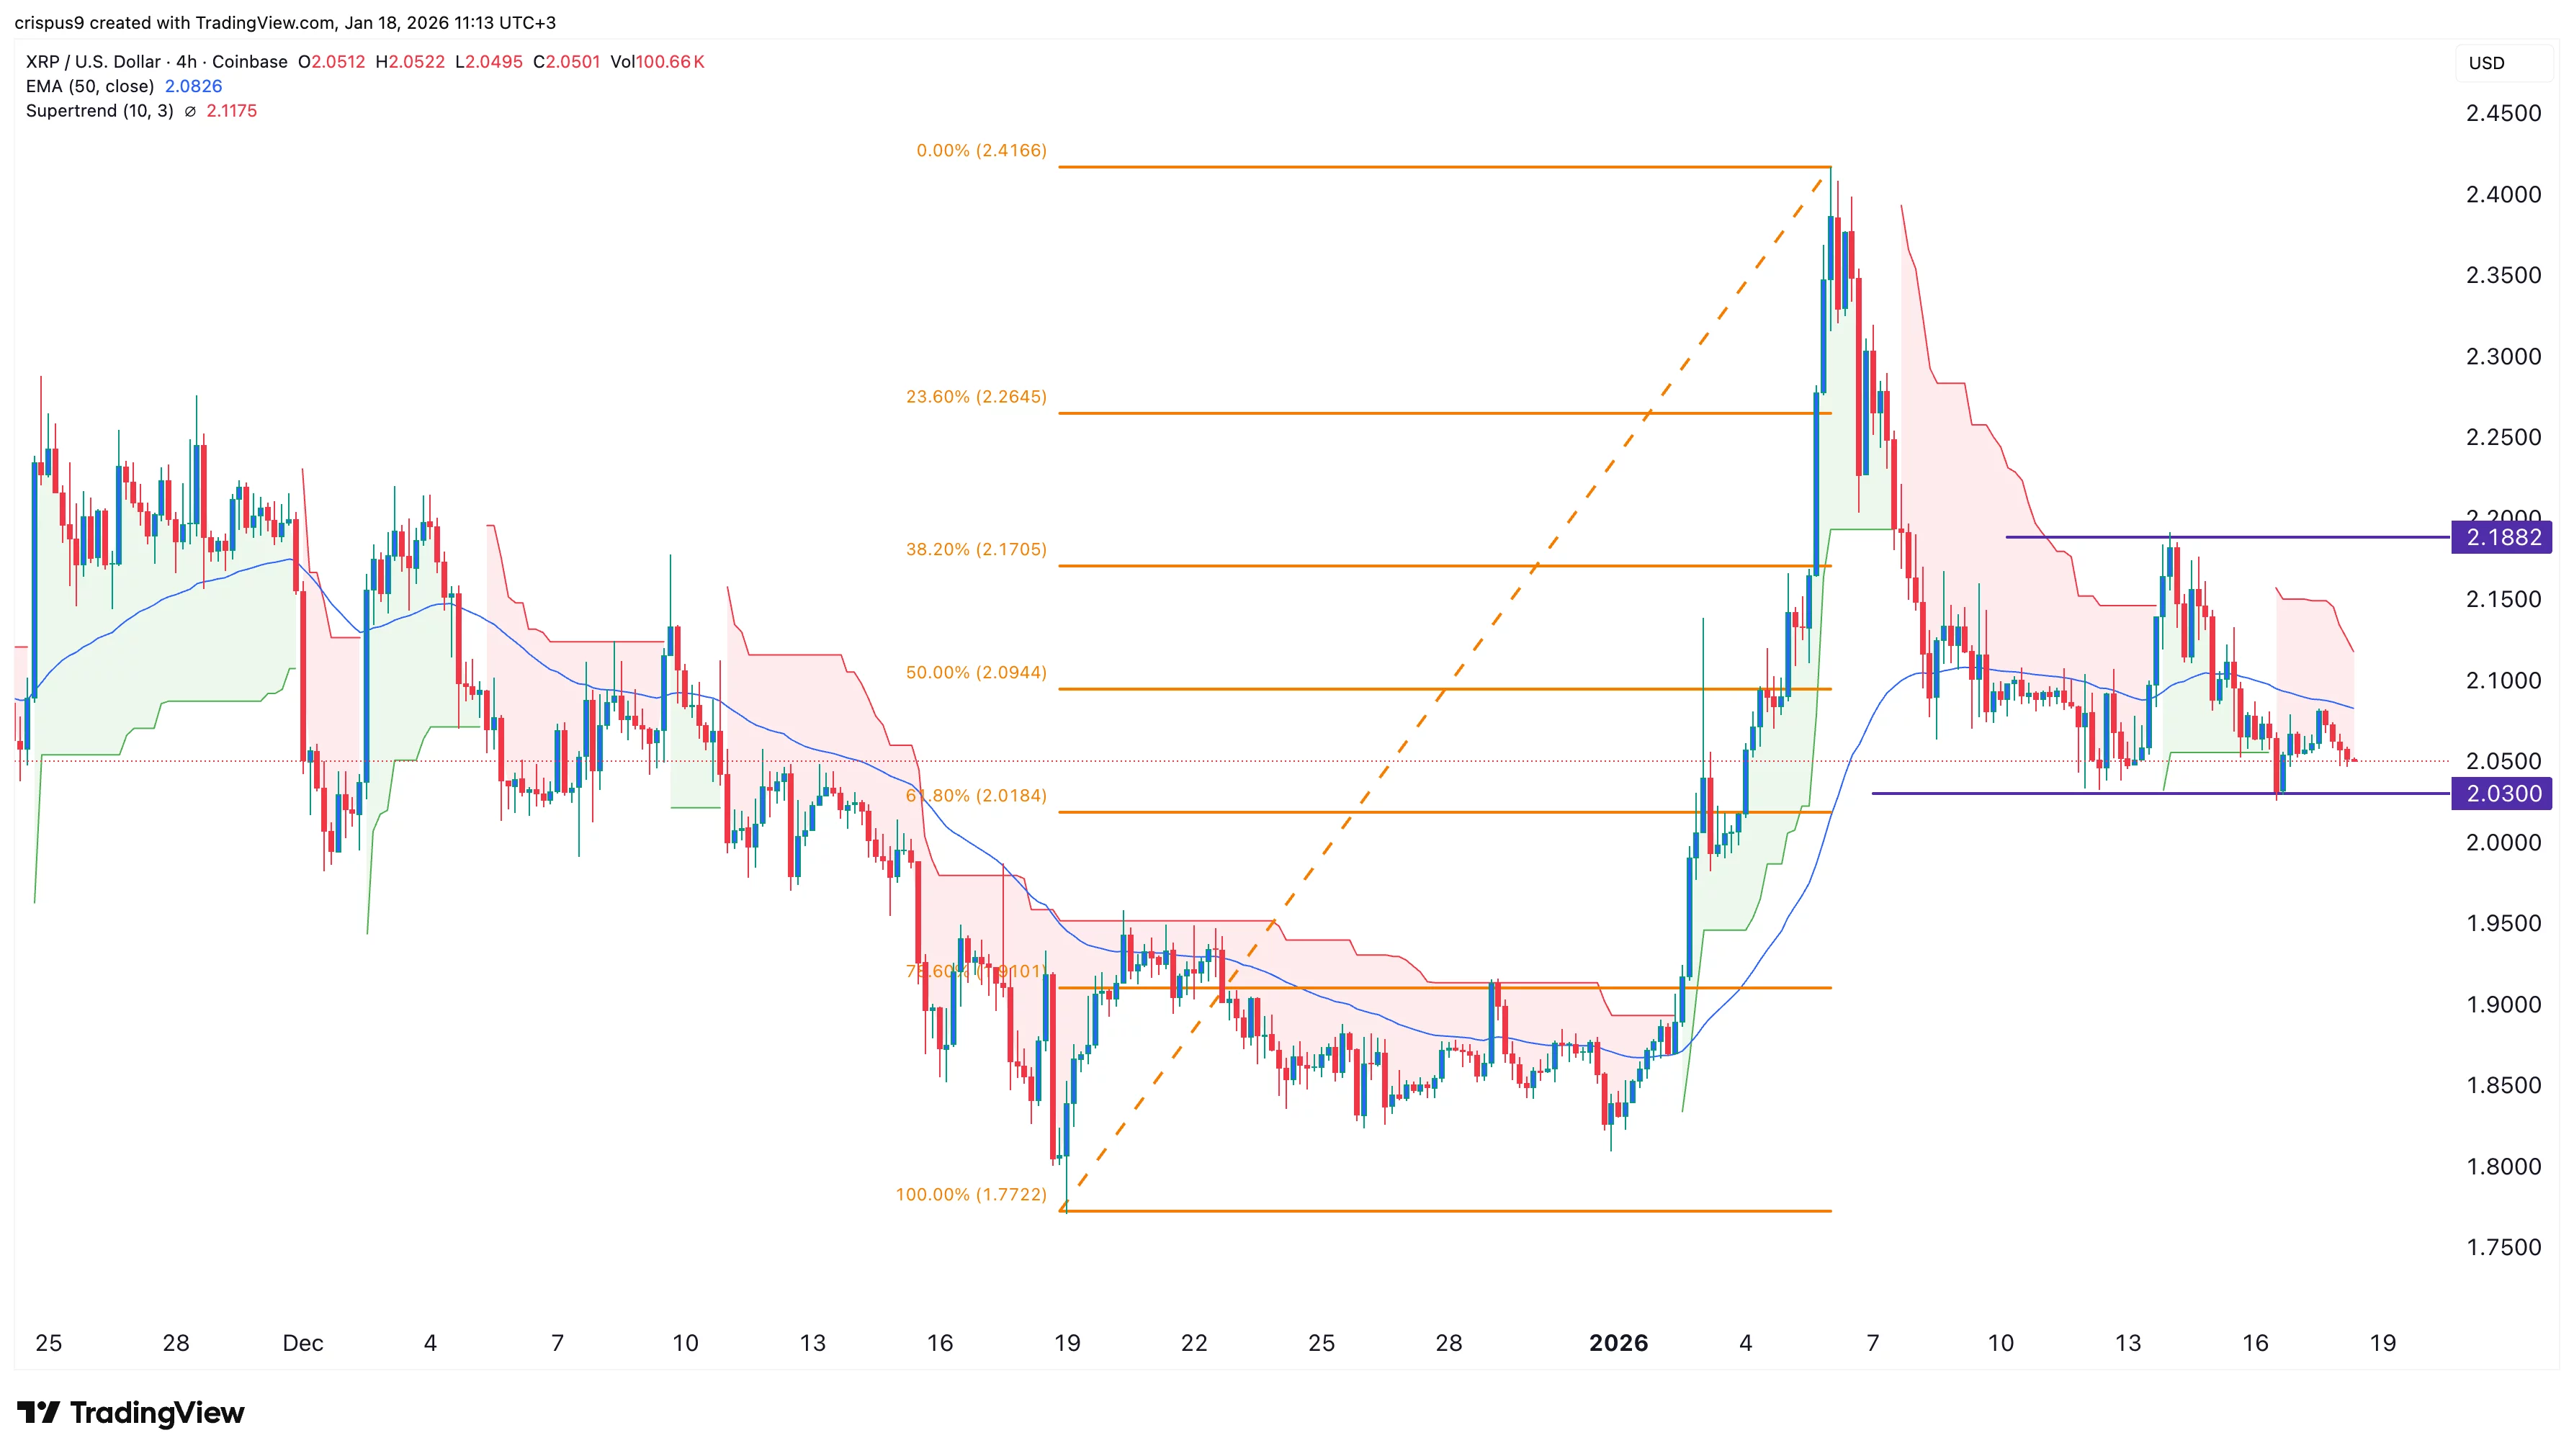
XRP price forms a double-bottom as weekly ETF inflows jump 47%
China’s Latest Surge in Tech Stocks Signals a Shift Away from Economic Slowdown