The 23-day simple moving average is about to cross above the 50-day SMA, a setup that marks early trend reversals when price holds structure.
SHIB trades near $0.00000870 after stabilizing above the $0.00000810 zone. The last time a similar setup appeared was in October, when SHIB rallied strongly shortly after.
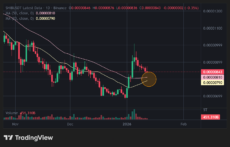
Source: TradingView
Meanwhile, as per TKR_Trading, whales are controlling SHIB’s exchange liquidity.
As per data, since December 5, exchanges have recorded a net outflow of 80 trillion SHIB, with exchange balances declining from 370.3 trillion to 290.3 trillion.
This generally means that SHIB traders prefer to hold onto their coins, rather than send them to exchanges to sell.
SHIB Price Analysis: Heavy Upside Potential Incoming
The chart below shows a clean descending channel from the 2024 highs.
Ths SHIB price is now very close to the lower boundary while momentum indicators flatten.
Several red candles have been printed, but none broke the support base.
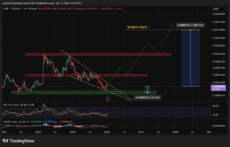
Source: TradingView
As long as $0.00000810 holds, the structure stays intact. A daily close below it invalidates the setup and opens the possibility of a pullback toward the green demand zone near $0.00000660.
On the other hand, $0.00000900 is the final ceiling. A break above it clears the path to the 200-day EMA at $0.00001054, roughly 22% above the current price.
While Shiba Inu is showing signs of life, the meme coin landscape has moved on, and the next big breakout is unlikely to come from the old names.
This isn’t a meme coin built on hype alone.
Maxi is creating a space for traders to share setups, strategies, and early opportunities, with engagement and rewards at the center.