
Bitcoin Structure Turns Bearish As Structural Indicators Flip Negative

By:Newsbtc
Bitcoin is struggling to reclaim the $90,000 level as it continues to test critical demand around the $86,000 zone. After weeks of corrective price action, bulls are finding it increasingly difficult to build a convincing case for trend continuation.
Momentum has faded, upside attempts have been rejected, and market confidence is weakening. As a result, a growing number of analysts are beginning to openly discuss the possibility that Bitcoin is transitioning into a broader bear market phase rather than a temporary pullback within a larger uptrend.
This shift in narrative is supported by structural data. In a recent analysis, Axel Adler highlights that Bitcoin’s price action is now aligned with a clear deterioration in market structure. His chart, which combines a composite Structure Shift signal with a Donchian Channel, shows that the indicator has decisively moved into negative territory.
var rnd = window.rnd || Math.floor(Math.random()*10e6); var pid607465 = window.pid607465 || rnd; var plc607465 = window.plc607465 || 0; var abkw = window.abkw || ''; var absrc = 'https://servedbyadbutler.com/adserve/;ID=172179;size=0x0;setID=607465;type=js;sw='+screen.width+';sh='+screen.height+';spr='+window.devicePixelRatio+';kw='+abkw+';pid='+pid607465+';place='+(plc607465++)+';rnd='+rnd+';click=CLICK_MACRO_PLACEHOLDER'; document.write('
');
if (!window.AdButler){(function(){var s = document.createElement("script"); s.async = true; s.type = "text/javascript";s.src = "https://servedbyadbutler.com/app.js";var n = document.getElementsByTagName("script")[0]; n.parentNode.insertBefore(s, n);}());}
var AdButler = AdButler || {}; AdButler.ads = AdButler.ads || []; var abkw = window.abkw || ""; var plc366606 = window.plc366606 || 0; (function(){ var divs = document.querySelectorAll(".plc366606:not([id])"); var div = divs[divs.length-1]; div.id = "placement_366606_"+plc366606; AdButler.ads.push({handler: function(opt){ AdButler.register(172179, 366606, [728,90], "placement_366606_"+opt.place, opt); }, opt: { place: plc366606++, keywords: abkw, domain: "servedbyadbutler.com", click:"CLICK_MACRO_PLACEHOLDER" }}); })();
The Structure Shift composite ranges from -1 to +1, with values below zero signaling bearish regime dominance. Currently, the signal sits near -0.5, a level historically associated with sustained downside pressure rather than short-lived corrections.
At the same time, Bitcoin price has dropped to the lower boundary of the 21-day Donchian Channel and is hovering just above the $85,000 support area. Together, these signals suggest that the market is operating in a risk-off environment, where downside risks remain elevated unless structure improves meaningfully.
Bitcoin Structure Confirms Bearish Regime
Adler notes that the current position of the Structure Shift composite signal confirms Bitcoin has firmly established itself within a bearish structural zone. With the indicator sitting below zero, the market is no longer in a neutral or transitional phase but operating under sustained downside conditions.
var rnd = window.rnd || Math.floor(Math.random()*10e6); var pid607472 = window.pid607472 || rnd; var plc607472 = window.plc607472 || 0; var abkw = window.abkw || ''; var absrc = 'https://servedbyadbutler.com/adserve/;ID=172179;size=0x0;setID=607472;type=js;sw='+screen.width+';sh='+screen.height+';spr='+window.devicePixelRatio+';kw='+abkw+';pid='+pid607472+';place='+(plc607472++)+';rnd='+rnd+';click=CLICK_MACRO_PLACEHOLDER'; document.write('
');
if (!window.AdButler){(function(){var s = document.createElement("script"); s.async = true; s.type = "text/javascript";s.src = "https://servedbyadbutler.com/app.js";var n = document.getElementsByTagName("script")[0]; n.parentNode.insertBefore(s, n);}());}
var AdButler = AdButler || {}; AdButler.ads = AdButler.ads || []; var abkw = window.abkw || ""; var plc452518 = window.plc452518 || 0; (function(){ var divs = document.querySelectorAll(".plc452518:not([id])"); var div = divs[divs.length-1]; div.id = "placement_452518_"+plc452518; AdButler.ads.push({handler: function(opt){ AdButler.register(172179, 452518, [728,90], "placement_452518_"+opt.place, opt); }, opt: { place: plc452518++, keywords: abkw, domain: "servedbyadbutler.com", click:"CLICK_MACRO_PLACEHOLDER" }}); })();
According to this framework, the primary trigger for improvement would be a decisive recovery of the composite signal back above the zero threshold, ideally while price continues to hold support within the Donchian Channel. Without that shift, any short-term bounce risks remaining corrective rather than trend-changing.
This bearish structure is reinforced by Bitcoin’s Bull-Bear market structure index, which focuses on derivatives dynamics through fast and slow regime components. The latest data shows the bullish component collapsing to just 5%, an extremely low reading that reflects the near absence of constructive long-side momentum. At the same time, the fast bearish component has moved deeper into negative territory, signaling rising seller pressure driven primarily by the futures market.
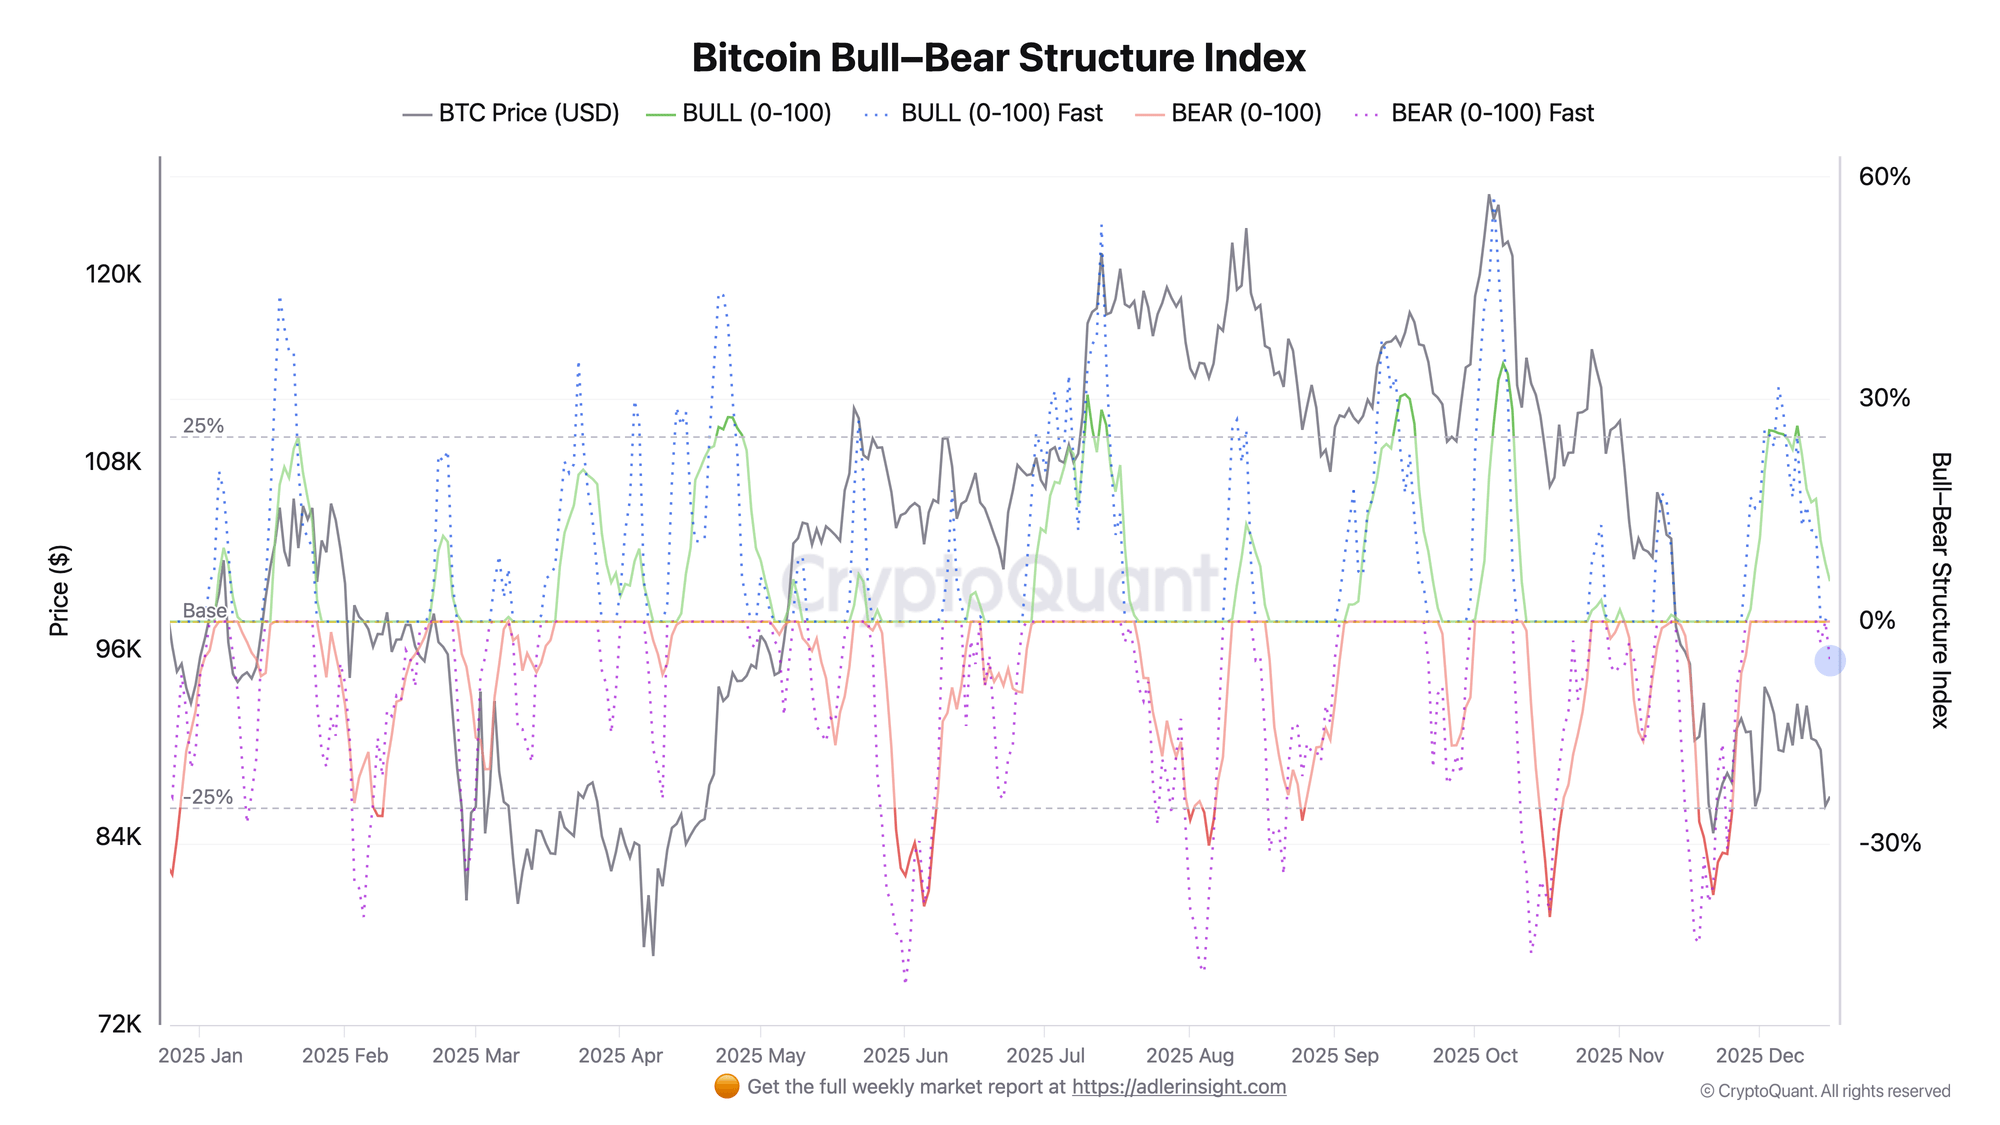 Bitcoin Bull-Bear Structure Index | Source:
CryptoQuant
Bitcoin Bull-Bear Structure Index | Source:
CryptoQuant
This configuration highlights a critical imbalance. Short-term momentum is firmly controlled by bears, while spot demand has so far proven insufficient to absorb derivatives-led selling pressure. For conditions to improve, the bullish component of the index would need to recover meaningfully, signaling renewed participation from buyers.
var rnd = window.rnd || Math.floor(Math.random()*10e6); var pid607473 = window.pid607473 || rnd; var plc607473 = window.plc607473 || 0; var abkw = window.abkw || ''; var absrc = 'https://servedbyadbutler.com/adserve/;ID=172179;size=0x0;setID=607473;type=js;sw='+screen.width+';sh='+screen.height+';spr='+window.devicePixelRatio+';kw='+abkw+';pid='+pid607473+';place='+(plc607473++)+';rnd='+rnd+';click=CLICK_MACRO_PLACEHOLDER'; document.write('
');
if (!window.AdButler){(function(){var s = document.createElement("script"); s.async = true; s.type = "text/javascript";s.src = 'https://servedbyadbutler.com/app.js';var n = document.getElementsByTagName("script")[0]; n.parentNode.insertBefore(s, n);}());}
var AdButler = AdButler || {}; AdButler.ads = AdButler.ads || []; var abkw = window.abkw || ''; var plc452519 = window.plc452519 || 0; (function(){ var divs = document.querySelectorAll(".plc452519:not([id])"); var div = divs[divs.length-1]; div.id = "placement_452519_"+plc452519; AdButler.ads.push({handler: function(opt){ AdButler.register(172179, 452519, [728,90], 'placement_452519_'+opt.place, opt); }, opt: { place: plc452519++, keywords: abkw, domain: 'servedbyadbutler.com', click:'CLICK_MACRO_PLACEHOLDER' }}); })();
Taken together, both indicators point to the same conclusion: Bitcoin has undergone a local structural shift into bearish territory. The dominant risk remains continued downside pressure driven by derivatives, especially in the absence of strong spot accumulation.
Who Really Sold The Dip? On-Chain Data Exposes Bitcoin’s True Sellers
Bitcoin Price Tests Critical Support as Downtrend Persists
Bitcoin continues to trade under clear downside pressure. The price now hovers around the $86,500 level after failing to reclaim higher resistance zones. The chart highlights a decisive breakdown below the short- and medium-term moving averages. With BTC trading well beneath the 50-day and 100-day averages. These levels, which previously acted as dynamic support during the uptrend, have now flipped into resistance. Reinforcing the bearish market structure.
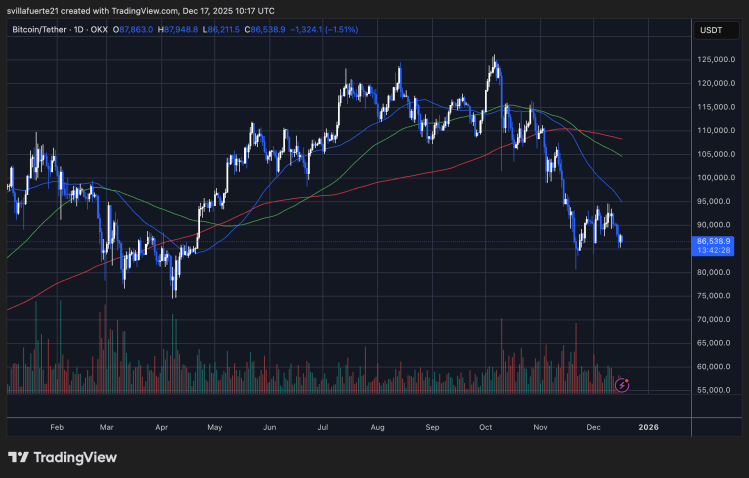
The most notable technical development is Bitcoin’s interaction with the 200-day moving average, shown in red. Price has briefly tested this long-term support but remains fragile, with follow-through buying notably absent. Historically, sustained trading below faster-moving averages while compressing near the 200-day often signals either a prolonged consolidation phase or the risk of an additional leg lower if demand fails to appear.

Why Bitcoin’s Quiet Price Action May Be ‘Dangerous’ – IFP Signals Rising Structural Risk
Structurally, Bitcoin remains in a lower-high, lower-low sequence since the October peak near $125K. As long as price remains capped below the $90K–$95K resistance zone, downside risks persist. For bulls to regain control, BTC must first stabilize above current demand and reclaim key moving averages. Signaling that sellers are losing dominance.
Featured image from ChatGPT, chart from TradingView.com
0
0
Disclaimer: The content of this article solely reflects the author's opinion and does not represent the platform in any capacity. This article is not intended to serve as a reference for making investment decisions.
PoolX: Earn new token airdrops
Lock your assets and earn 10%+ APR
Lock now!
You may also like
Meta is pausing its dream of sharing Quest’s Horizon OS with third-party headset makers
TechCrunch•2025/12/17 19:42
NEIRO Holds Tight Range as Price Trades Near Key Support and Resistance
Cryptonewsland•2025/12/17 19:39
ChainGPT Unveils AI Hub V2 to Advance Crypto Research, Web3 Intelligence, and Trading
BlockchainReporter•2025/12/17 19:15
Robinhood Lists PIPPIN: A Bold Move for Mainstream Crypto Adoption
Bitcoinworld•2025/12/17 19:12
Trending news
MoreCrypto prices
MoreBitcoin
BTC
$86,112.21
-1.77%
Ethereum
ETH
$2,818.25
-4.48%
Tether USDt
USDT
$0.9997
-0.01%
BNB
BNB
$840.44
-3.48%
XRP
XRP
$1.86
-3.31%
USDC
USDC
$1
+0.01%
Solana
SOL
$122.36
-4.28%
TRON
TRX
$0.2794
-0.49%
Dogecoin
DOGE
$0.1262
-4.57%
Cardano
ADA
$0.3685
-4.90%
How to buy BTC
Bitget lists BTC – Buy or sell BTC quickly on Bitget!
Trade now
Become a trader now?A welcome pack worth 6200 USDT for new users!
Sign up now