Date: Tue, Dec 16, 2025 | 02:00 PM GMT
The cryptocurrency market continues to face heavy selling pressure as the total crypto market capitalization slipped by 3.17% over the past 24 hours. This renewed wave of volatility dragged Ethereum (ETH) lower, with the second-largest cryptocurrency shedding more than 6% during the session.
Despite the sharp decline, the broader chart structure suggests ETH is now approaching a critical technical inflection point that could define its next major move.
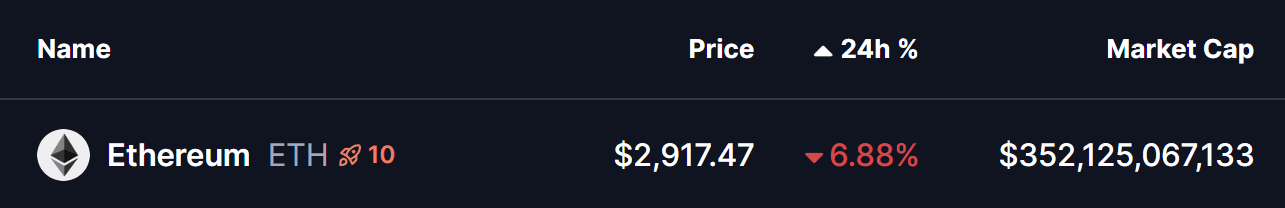 Source: Coinmarketcap
Broadening Wedge Setup in Play
On the daily chart, Ethereum is forming an ascending broadening wedge, a pattern characterized by expanding volatility and growing uncertainty among market participants. While this structure often carries bearish implications over the long term, it also allows for powerful counter-trend rebounds as price oscillates between widening boundaries.
ETH’s latest sell-off followed a rejection from the wedge’s upper trendline near the $3,447 level on December 10. That rejection triggered a swift pullback toward the lower boundary of the formation. Price briefly dipped into the $2,877 area before finding support and rebounding back above the $2,900 mark.
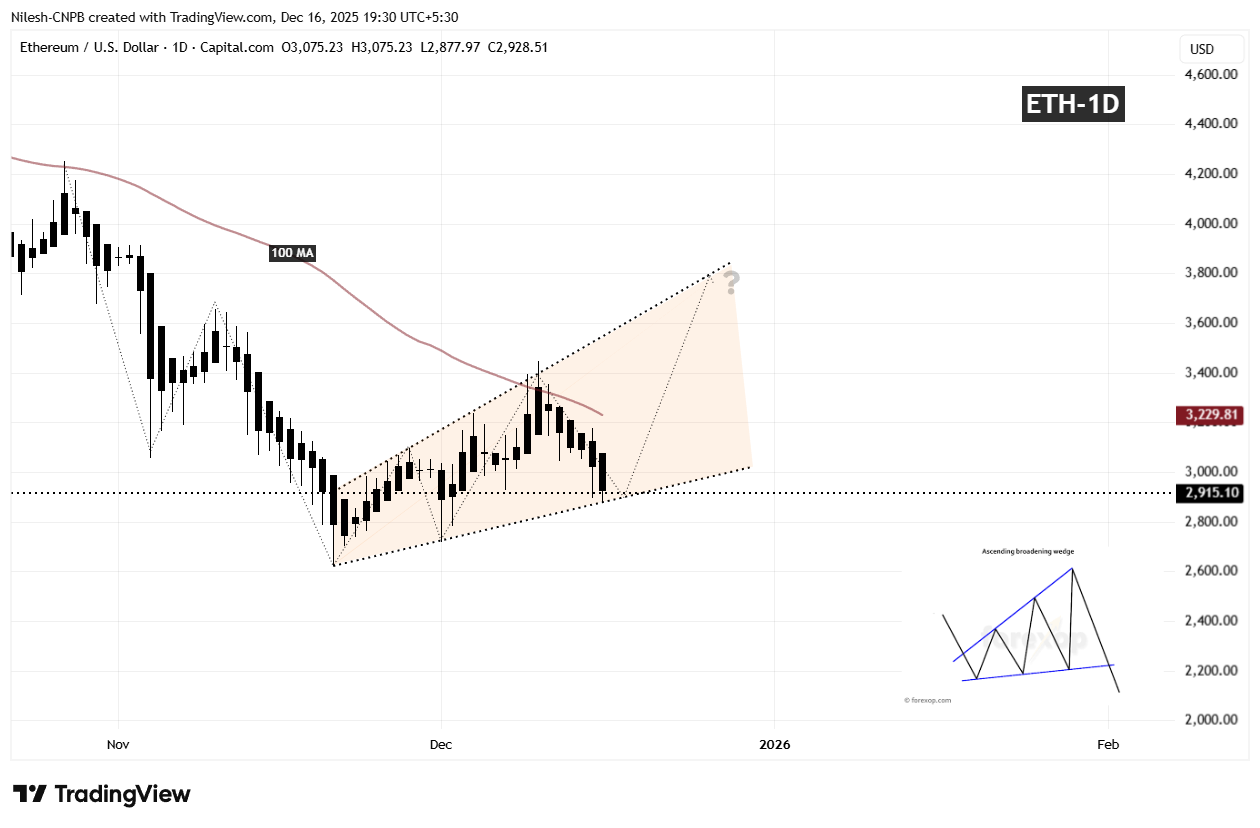 Ethereum (ETH) Daily Chart/Coinsprobe (Source: Tradingview)
This lower trendline now stands as a crucial technical floor. It has acted as dynamic support throughout ETH’s broader uptrend since mid-year, making it the primary zone bulls must defend. At the same time, ETH continues to trade below the 100-day moving average around $3,229, which remains an overhead resistance capping upside momentum for now.
What Next for ETH?
As long as Ethereum holds above the $2,877 support zone, the structure of the ascending wedge remains intact. A sustained defense of this level, followed by a reclaim of the 100-day moving average, could trigger a recovery attempt toward the upper boundary of the wedge near the $3,792 region. Such a move would re-ignite bullish momentum and keep the broader uptrend narrative alive.
However, if sellers regain control and push price below the lower wedge boundary, the pattern’s bearish bias would begin to assert itself. In that scenario, ETH could slide toward the $2,718 support area, marking a deeper corrective phase and a shift in short-term sentiment.
For now, Ethereum sits at a decisive technical crossroads. The reaction around the $2,877 level will likely determine whether ETH stages a meaningful rebound or transitions into a more prolonged period of downside consolidation.