
XRP Price Positive Streak Fades—Are Traders Bracing for Volatility?

XRP price started a decent increase above $2.150. The price is now correcting gains and might struggle to stay in a positive zone.
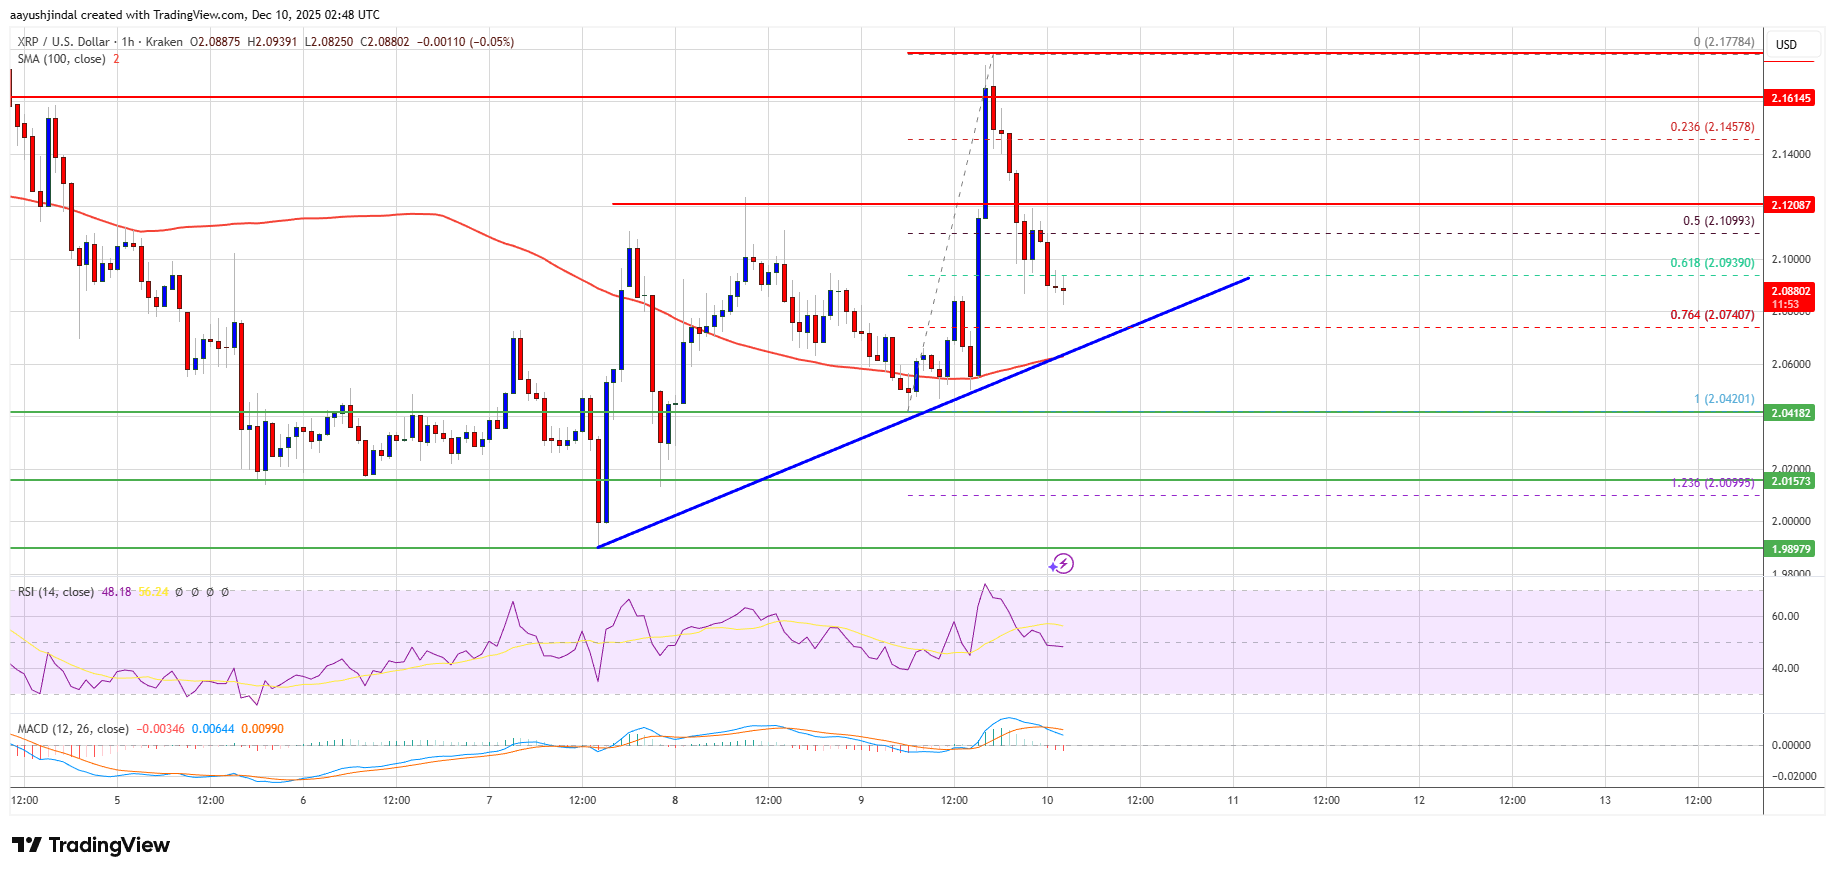
- XRP price started a downside correction and tested the $2.080 zone.
- The price is now trading above $2.050 and the 100-hourly Simple Moving Average.
- There is a bullish trend line forming with support at $2.070 on the hourly chart of the XRP/USD pair (data source from Kraken).
- The pair could start another increase if it clears $2.120.
XRP Price Dips Again
XRP price started a downside correction from the $2.180 zone, like Bitcoin and Ethereum. The price dipped below the $2.150 and $2.120 levels to enter a consolidation phase.
The price even dipped below the 50% Fib retracement level of the upward move from the $2.042 swing low to the $2.1778 high. However, the bulls remained active above the $2.080 support. There is also a bullish trend line forming with support at $2.070 on the hourly chart of the XRP/USD pair.
The price is now trading above $2.050 and the 100-hourly Simple Moving Average. If there is a fresh upward move, the price might face resistance near the $2.120 level.
The first major resistance is near the $2.150 level, above which the price could rise and test $2.180. A clear move above the $2.180 resistance might send the price toward the $2.2250 resistance. Any more gains might send the price toward the $2.250 resistance. The next major hurdle for the bulls might be near $2.2880.
More Losses?
If XRP fails to clear the $2.120 resistance zone, it could start a fresh decline. Initial support on the downside is near the $2.070 level, the 76.4% Fib retracement level of the upward move from the $2.042 swing low to the $2.1778 high, and the trend line. The next major support is near the $2.050 level.
If there is a downside break and a close below the $2.050 level, the price might continue to decline toward $2.00. The next major support sits near the $1.9850 zone, below which the price could continue lower toward $1.920.
Technical Indicators
Hourly MACD – The MACD for XRP/USD is now gaining pace in the bearish zone.
Hourly RSI (Relative Strength Index) – The RSI for XRP/USD is now below the 50 level.
Major Support Levels – $2.070 and $2.050.
Major Resistance Levels – $2.120 and $2.180.
Disclaimer: The content of this article solely reflects the author's opinion and does not represent the platform in any capacity. This article is not intended to serve as a reference for making investment decisions.
You may also like
Cardano Shows Strong Momentum as ADA Leads Today’s Crypto Market
Quick Take Summary is AI generated, newsroom reviewed. ADA jumps 8 percent in 24 hours and leads major altcoins. Cardano price rally gains strength with rising demand and strong momentum. ADA trading volume increases 72 percent and shifts altcoin market trends. Traders expect more movement as ADA builds support and shows strong conviction.References 🚨CARDANO IS UP BIG IN 24H! #Cardano leads high-cap altcoins as $ADA jumps 8% in 24 hours, with trading volume soaring 72%.
Twenty One Capital Enters NYSE Trading with a Major Bitcoin Treasury
Michael Saylor Bitcoin Advice Sparks Interest Amid Schiff Criticism
BlackRock Bitcoin ETF Sees $135.4M Outflow This Month