Date: Sun, Dec 07, 2025 | 06:30 AM GMT
Hyperliquid (HYPE), after printing its all-time high of $59.12 back in Sept 2025, has entered a cooling phase, correcting over 32% in the past two months. While sentiment has shifted from euphoric to cautious, the chart is presenting something far more valuable than noise — a repeating structural formation that strongly echoes Chainlink’s (LINK) mid-2024 fractal recovery.
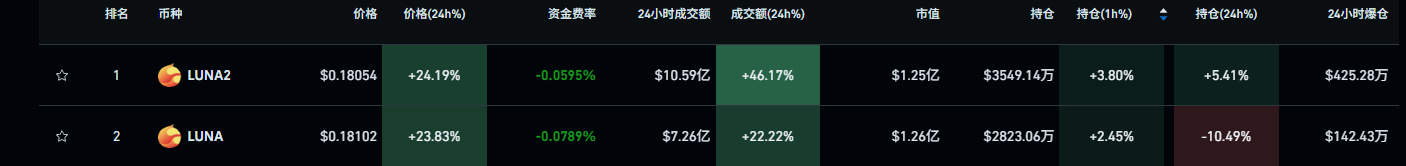
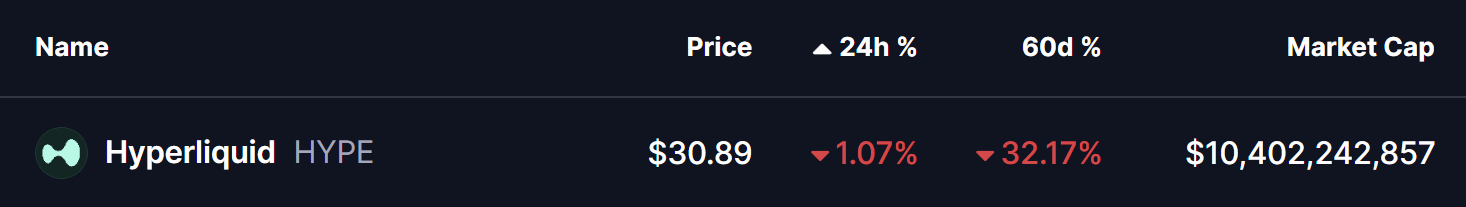 Source: Coinmarketcap
HYPE Mirrors LINK’s Fractal Setup
A side-by-side fractal comparison between LINK (May 2024) and HYPE (current) reveals an almost identical head-and-shoulder formation followed by a corrective sweep into support.
In LINK’s pattern, after forming the head, the moving average crossover triggered a 29% drop back to its demand block (blue zone). Price then compressed inside a tight consolidation range (green box) before expanding upward to form the right shoulder — initiating the next breakout phase.
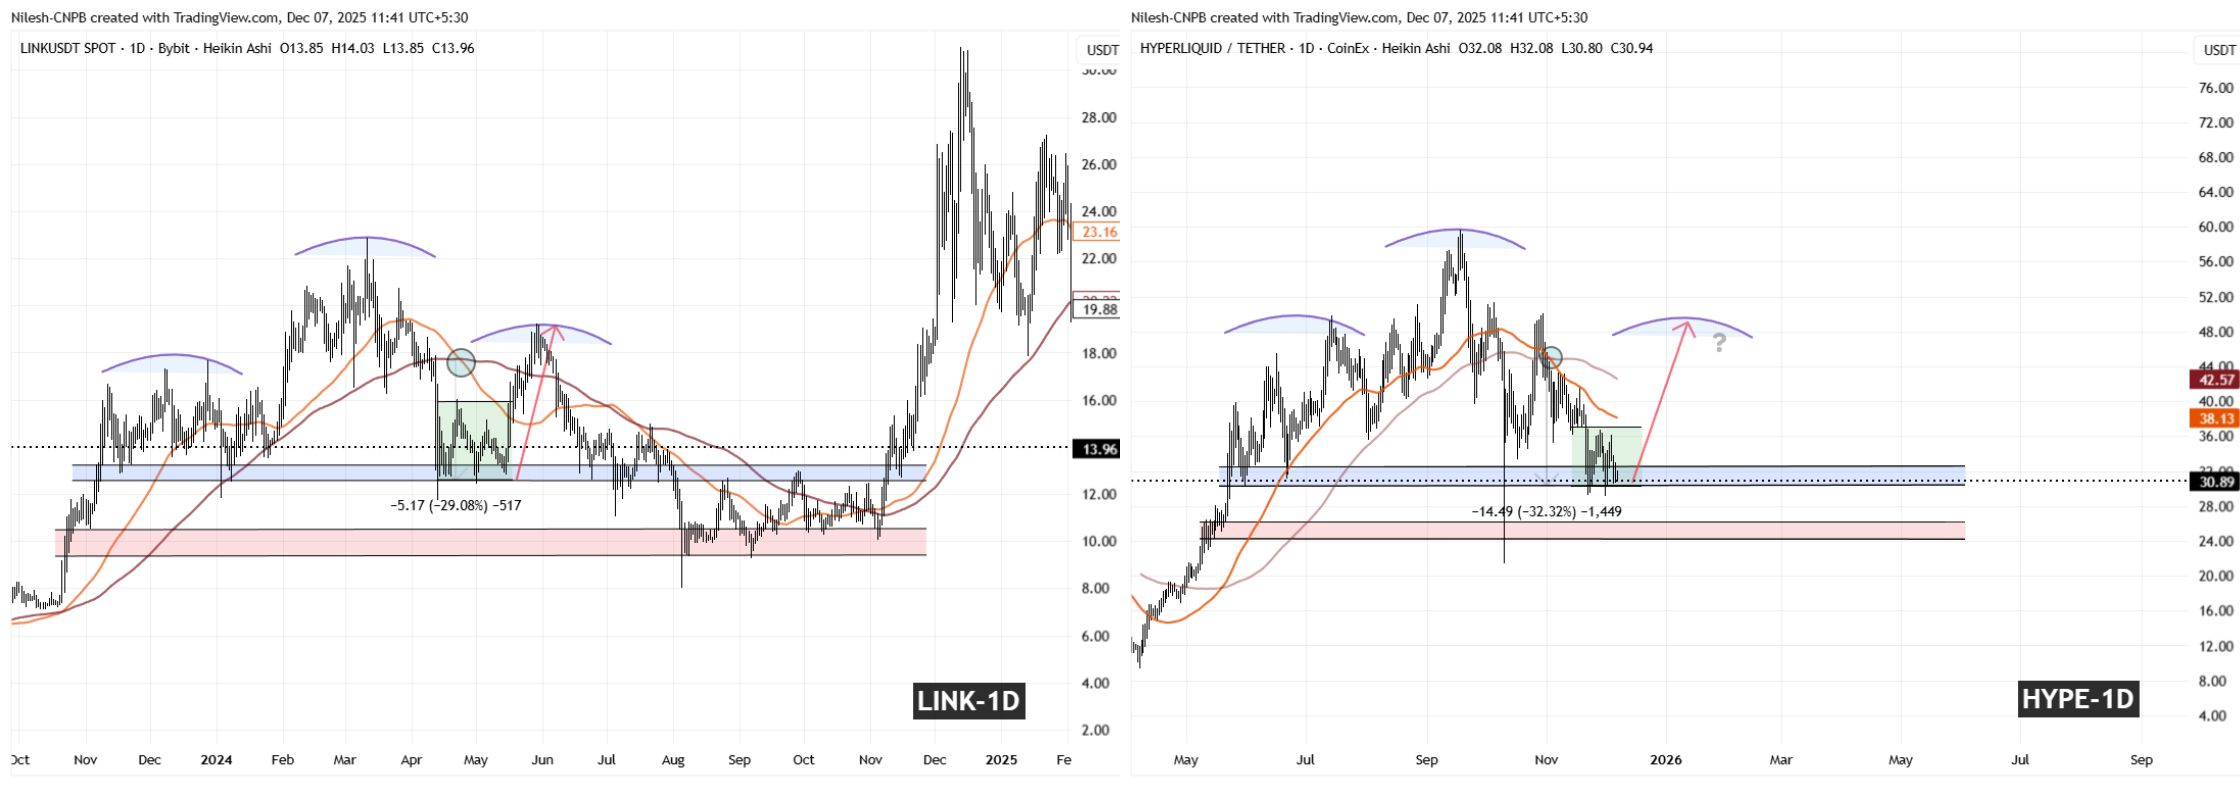 LINK and HYPE Fractal Chart/Coinsprobe (Source: Tradingview)
HYPE is now walking the same technical pathway.
A similar MA crossover has occurred right after the peak formation, followed by a 32% pullback directly into the $29.50–$32.50 demand pocket (blue zone). This is the exact price structure confluence that acted as a springboard for LINK’s rebound (green zone).
If the fractal symmetry continues to hold, HYPE is not breaking structure — it is building it.
What’s Next for HYPE?
If buyers continue to defend the $29.09–$32.50 support range, the next key trigger becomes the reclaim of the 50-day MA at $38.13. A successful reclaim could activate a measured upside leg into the $48–$50 region — aligning precisely with the right-shoulder completion zone of LINK.
However, caution remains if price loses the structural floor.
A daily close below $29.09 would begin to weaken the fractal symmetry, opening the chart to a deeper liquidity sweep toward the next downside cushion at $25.00 (red zone). Unlike LINK’s clean rebound, this scenario could extend consolidation before any meaningful upside attempt.