Date: Sun, Dec 07, 2025 | 09:55 AM GMT
The broader crypto market begins the week on a cautionary note as mild downside in Bitcoin (BTC) and Ethereum (ETH) continues to pressure mid-cap performers. Hyperliquid (HYPE) , which has already undergone a multi-week corrective phase, dipped another 5% today — but beneath this weakness lies a technical formation that could be setting the stage for a bullish reversal.
 Source: Coinmarketcap
Triple Bottom in Play
A clear Triple Bottom structure has emerged on the 4H timeframe — a classic reversal pattern characterized by three equal swing lows at a shared support base. Each dip toward the $29.15 support region has been met with notable buying pressure, suggesting demand absorption and exhaustion among sellers.
Across the highlighted consolidation zone, price continues to oscillate between the bottom floor at $29.15 and neckline resistance at $36.20, as seen repeatedly over the past two weeks. The latest retest once again brings HYPE to the same demand inflection point that previously triggered sharp upside moves.
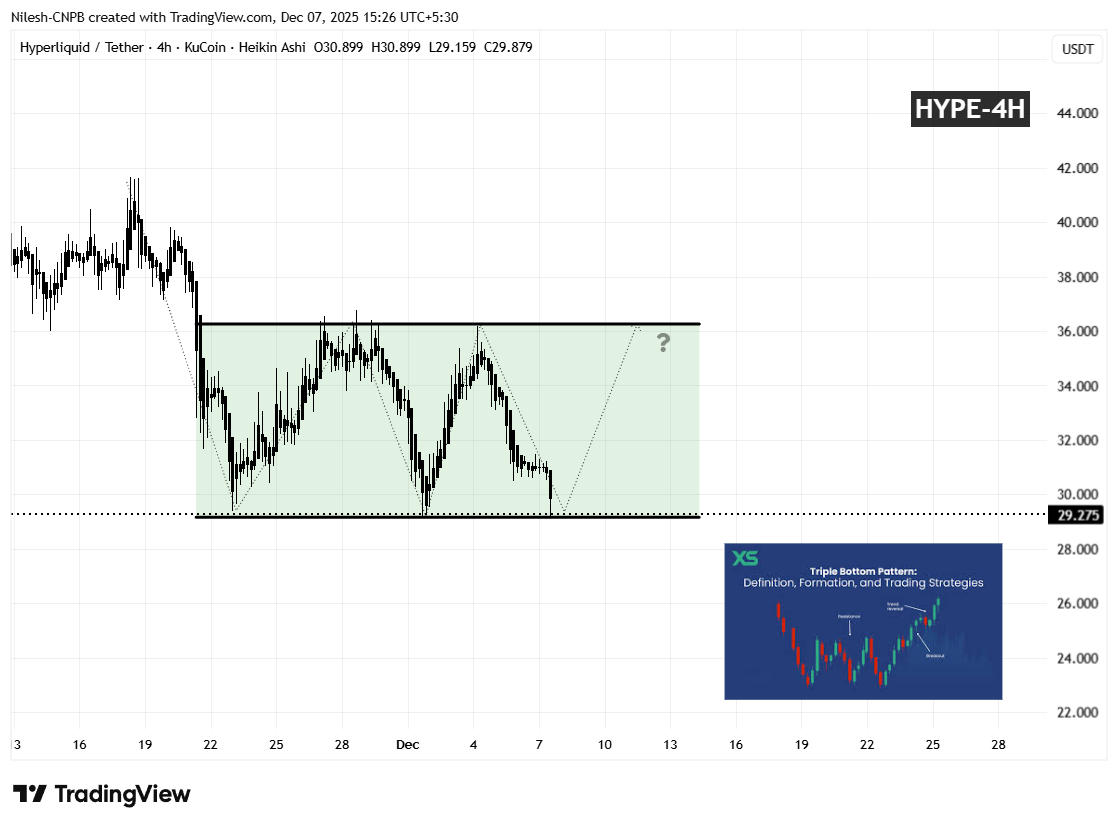 Hyperliquid (HYPE) 4H Chart/Coinsprobe (Source: Tradingview)
This repeated defense is a strong sign of accumulation rather than continuation breakdown.
What’s Next for HYPE?
If buyers remain active at the $29.15 support and prevent any candle close below the range, HYPE could confirm its third structural low — completing the Triple Bottom formation and setting up a potential climb toward:
• Neckline resistance: $36.20
(upside potential of approx. +24% from current range)
A breakout above the neckline could further unlock a continuation leg toward the mid-$40 region, but that confirmation remains dependent on volume expansion and clean invalidation of the range ceiling.
However, if the price weakens and breaks and closes below $29.15, the bullish reversal scenario loses validity. Such a breakdown would convert the floor into resistance and may open the door toward deeper liquidity zones in the $26.50–$27.00 range.
For now, the market sits at a technical pressure point:
third test → rebound or rejection.