XRP Price Sits 3% From Breakdown, but A Rare On-Chain Hope Appears

XRP has been one of the weakest large-cap movers this week. The XRP price dropped about 1.1% since yesterday and is now down almost 11% over the last 7 days. The move comes as the chart shows a heavy breakdown structure, but one rare on-chain signal has flipped and now stands between XRP and a
XRP has been one of the weakest large-cap movers this week. The XRP price dropped about 1.1% since yesterday and is now down almost 11% over the last 7 days. The move comes as the chart shows a heavy breakdown structure, but one rare on-chain signal has flipped and now stands between XRP and a deeper fall.
This mix keeps both sides open as XRP trades near a major decision point.
Breakdown Structure Tightens as Critical Support Zone Surfaces
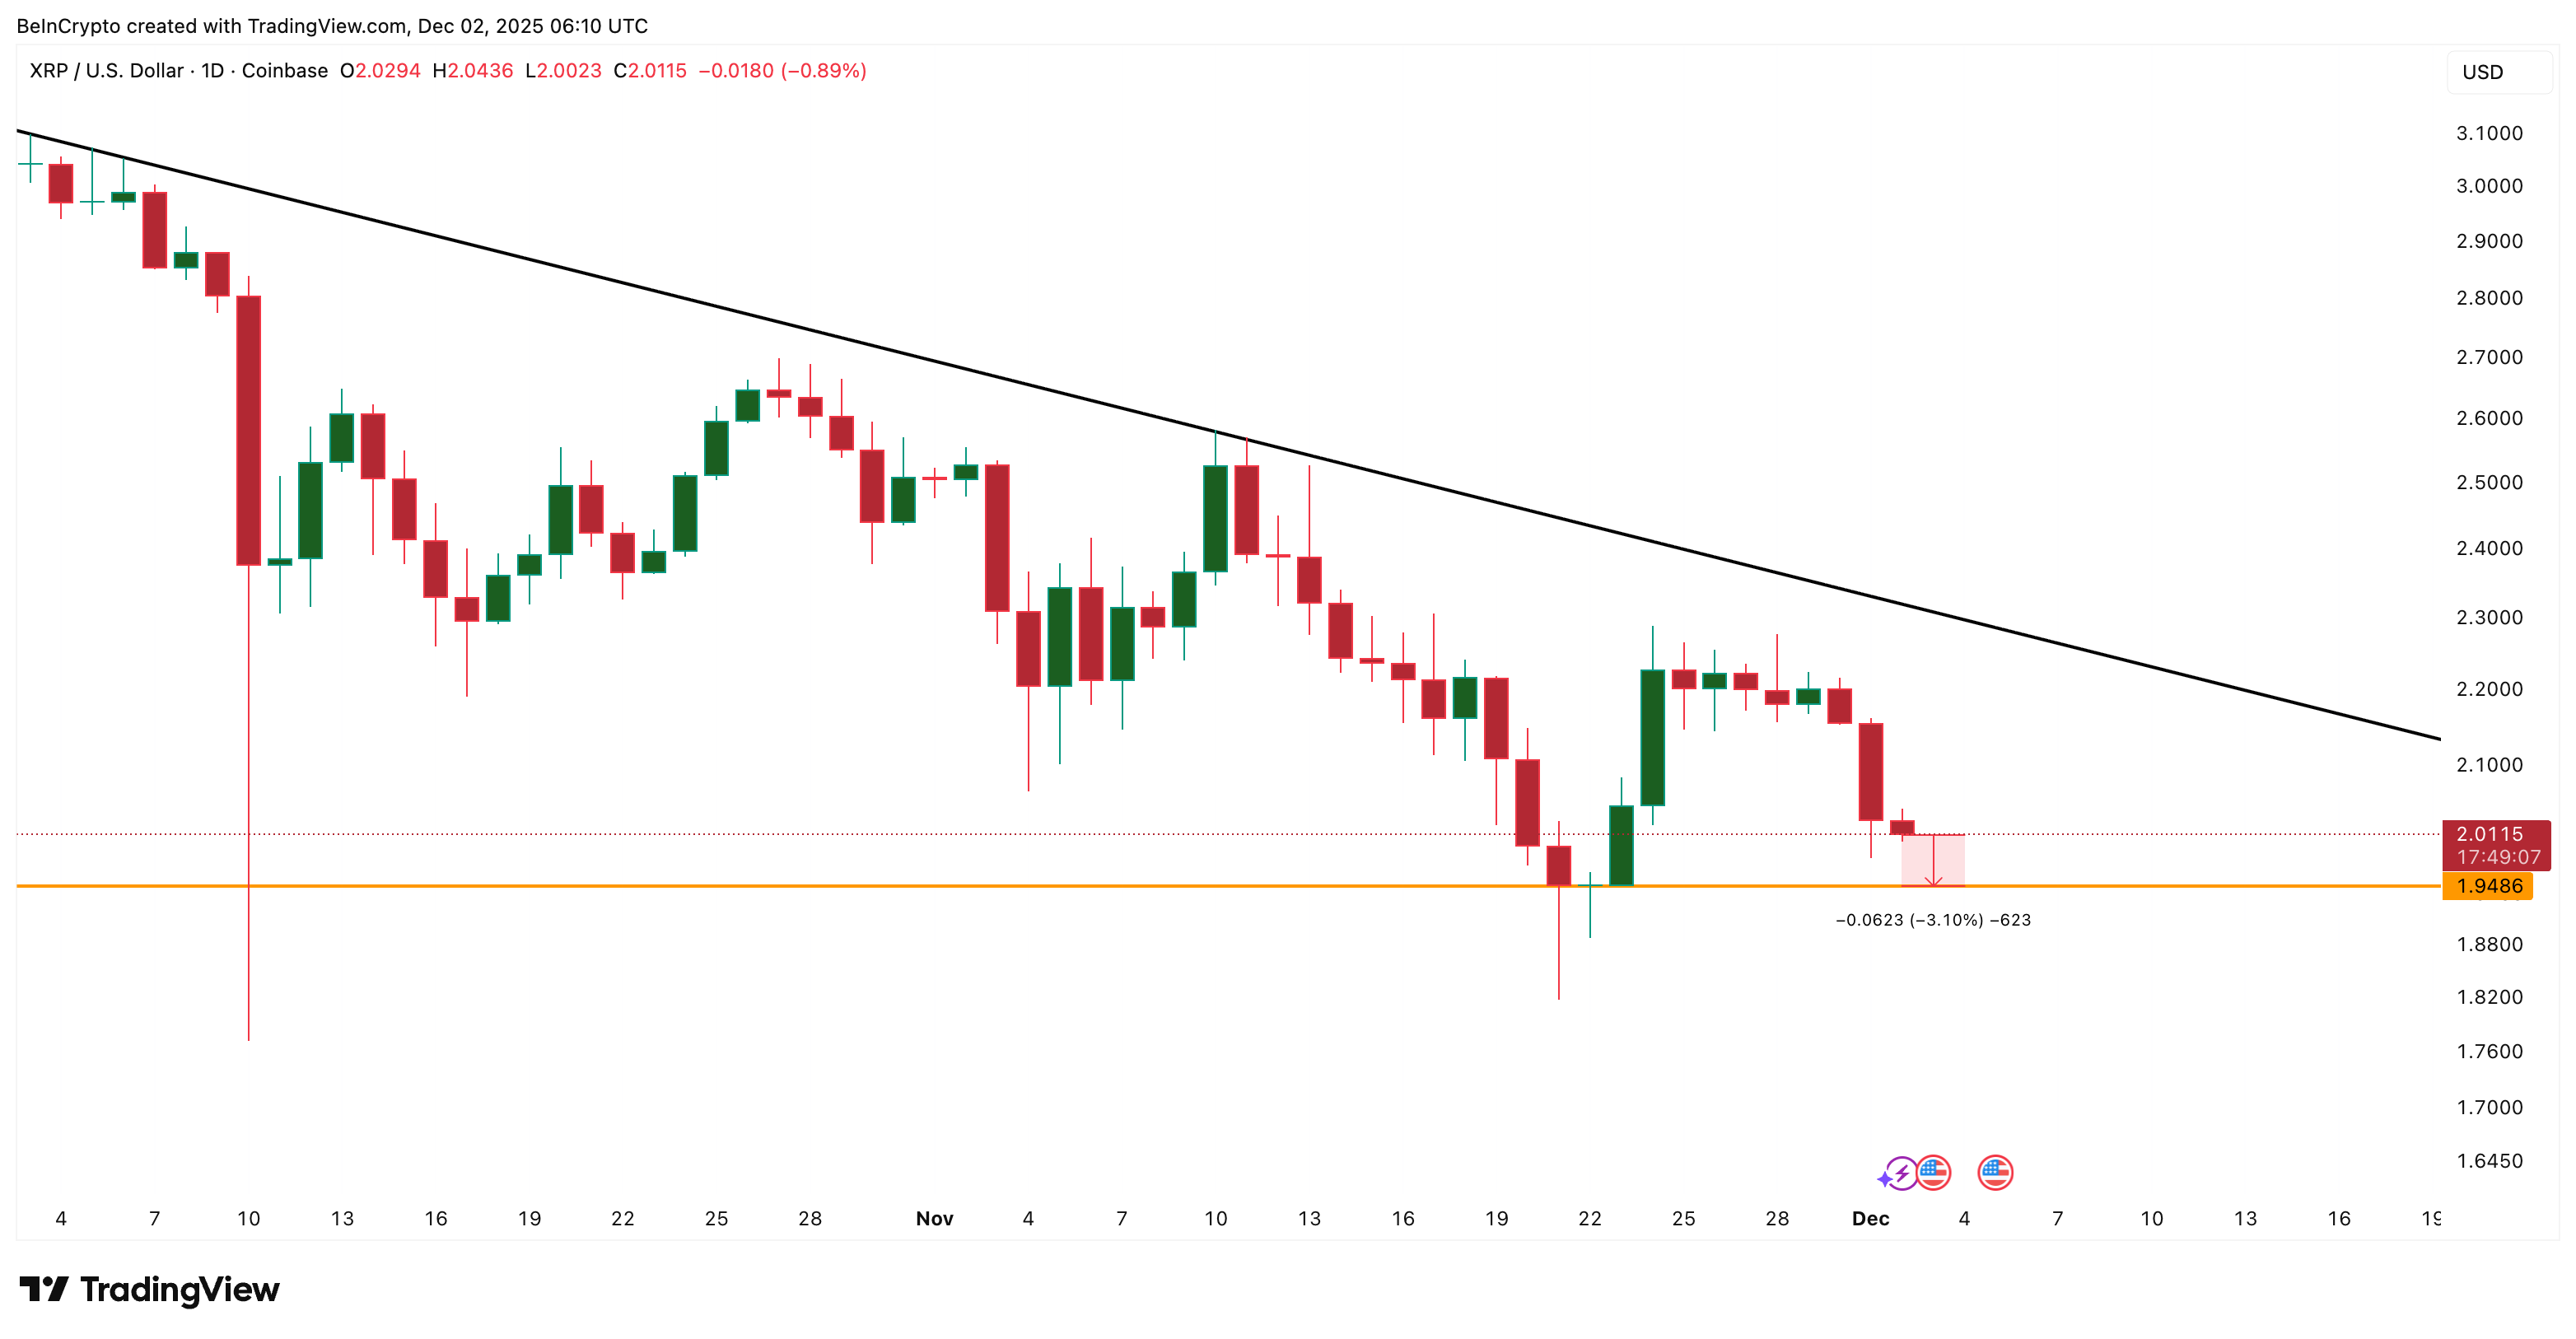
XRP continues to move under a descending trend line. This trend line has formed the upper boundary of a broad triangle-type structure, with the $1.94 level acting as the base. This is a typical bearish pattern.
If the price falls under $1.94, it would break through the base of this descending structure and confirm another downside extension. XRP is only about 3% away from testing that zone.
Want more token insights like this? Sign up for Editor Harsh Notariya’s Daily Crypto Newsletter.
 XRP’s Bearish Structure:
TradingView
XRP’s Bearish Structure:
TradingView
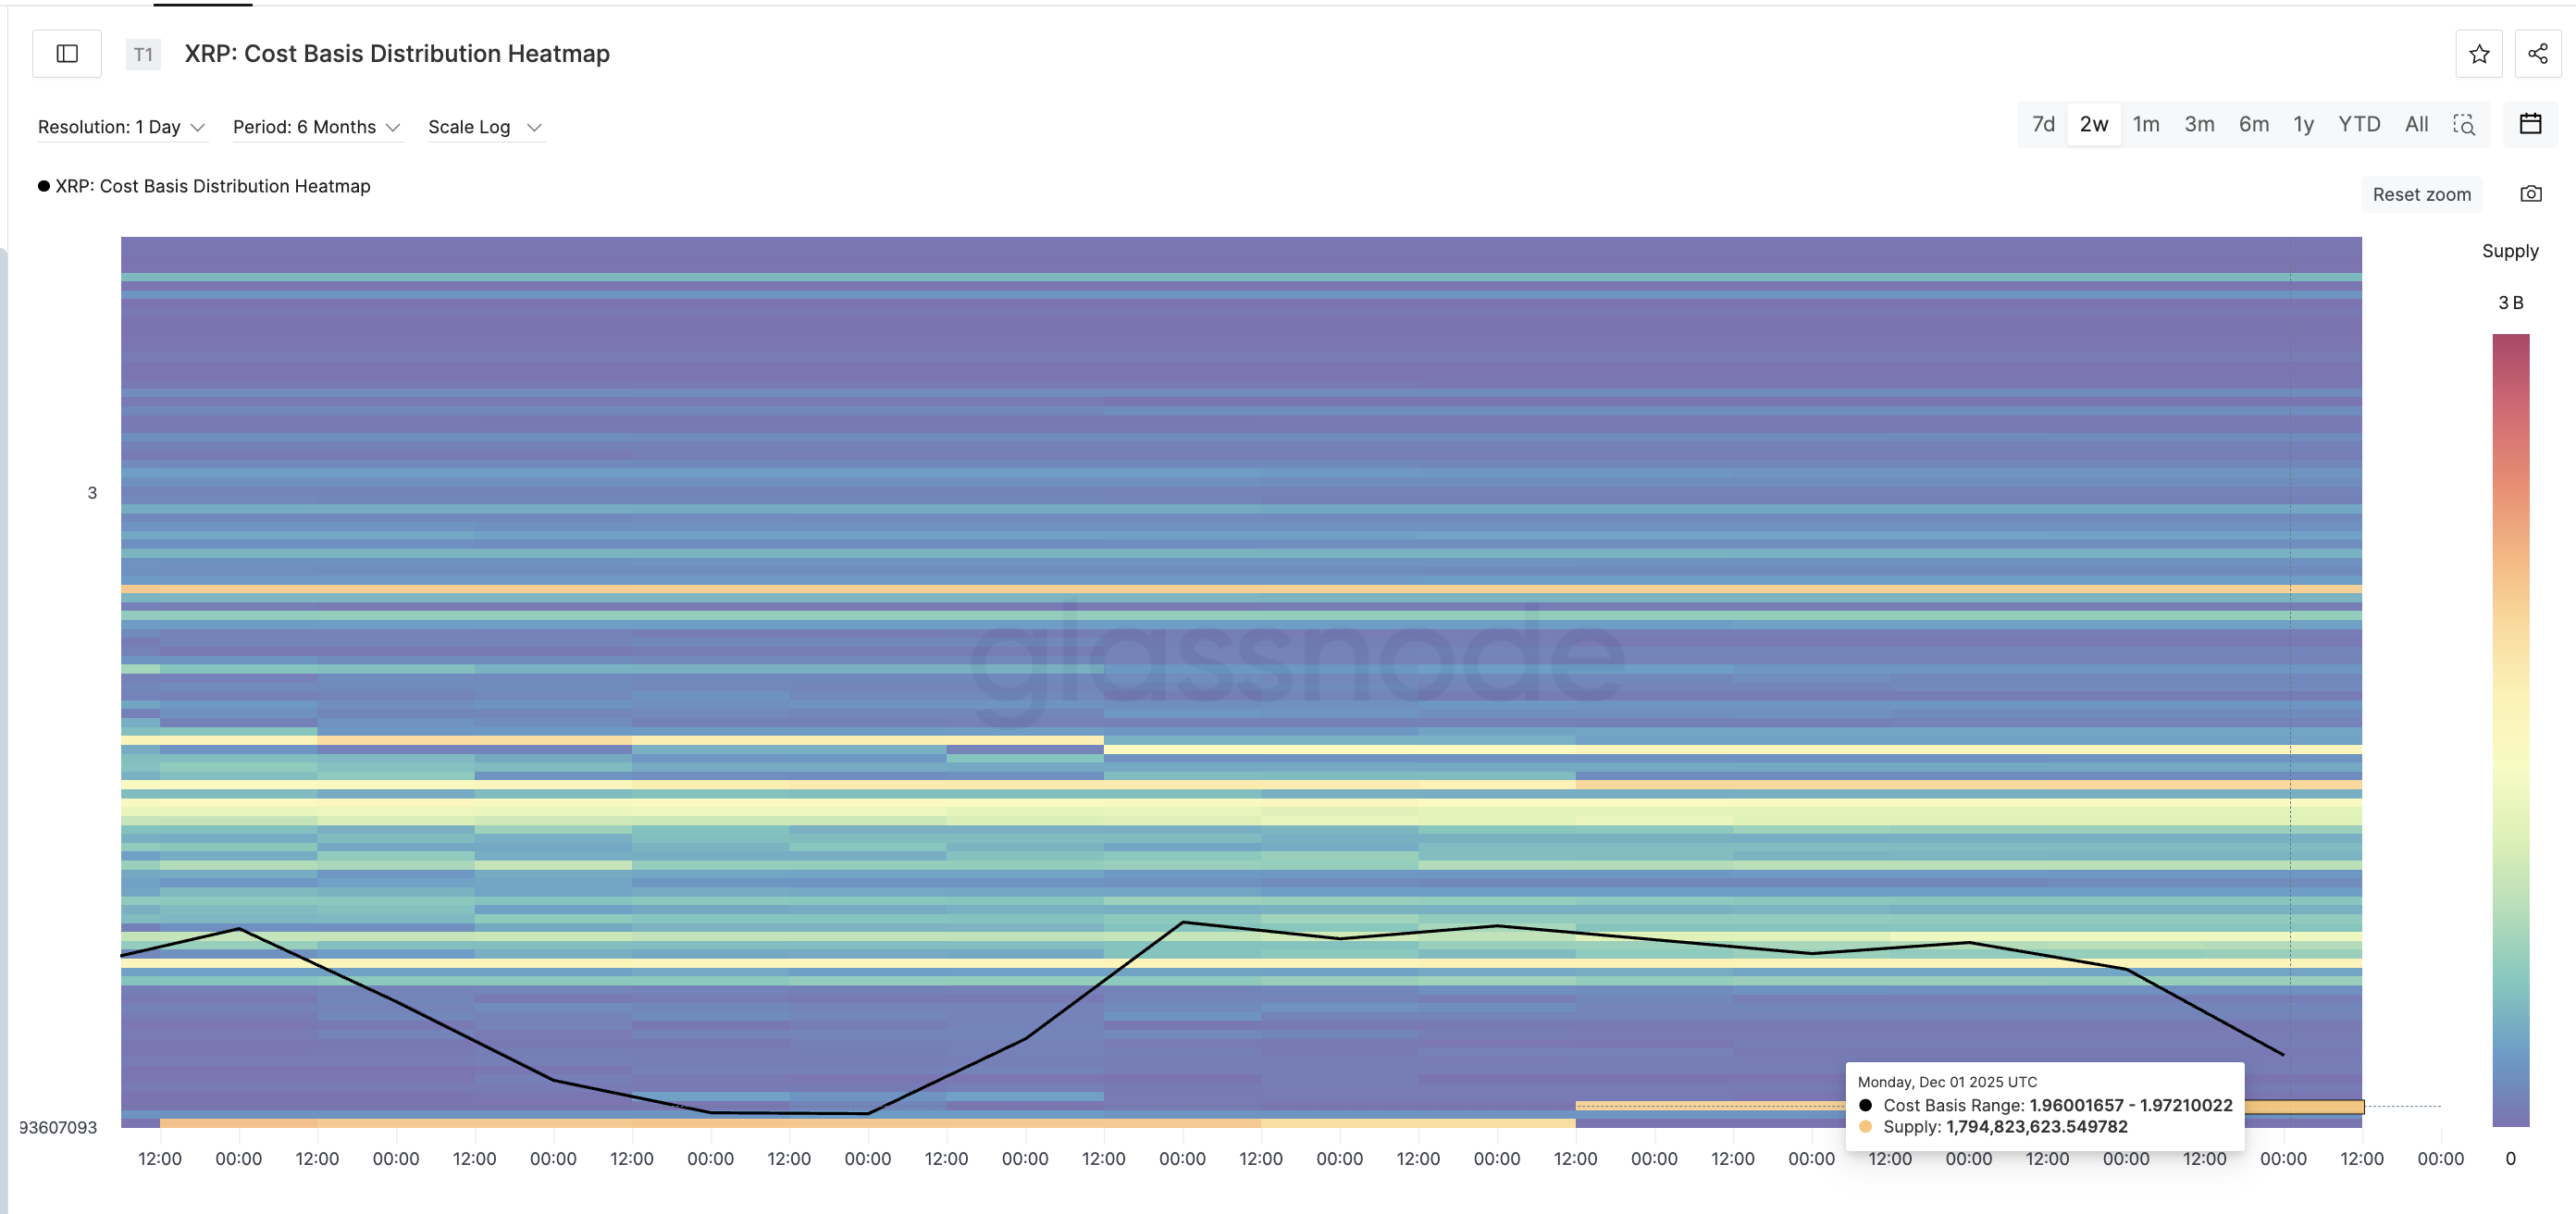
The cost-basis heatmap reinforces this level.
A cost-basis heatmap shows where most tokens were originally bought. These areas act like strong support or resistance.
Right now, the strongest cluster sits between $1.96 and $1.97. Around 1.79 billion XRP sit in this range. If XRP falls below $1.96, especially $1.94, the entire cluster gets forced underwater, and the price can fall much faster toward the next major zone, highlighted later in the piece.
This is the cleanest technical and on-chain overlap on the chart.
 Key Support Cluster:
Glassnode
Key Support Cluster:
Glassnode
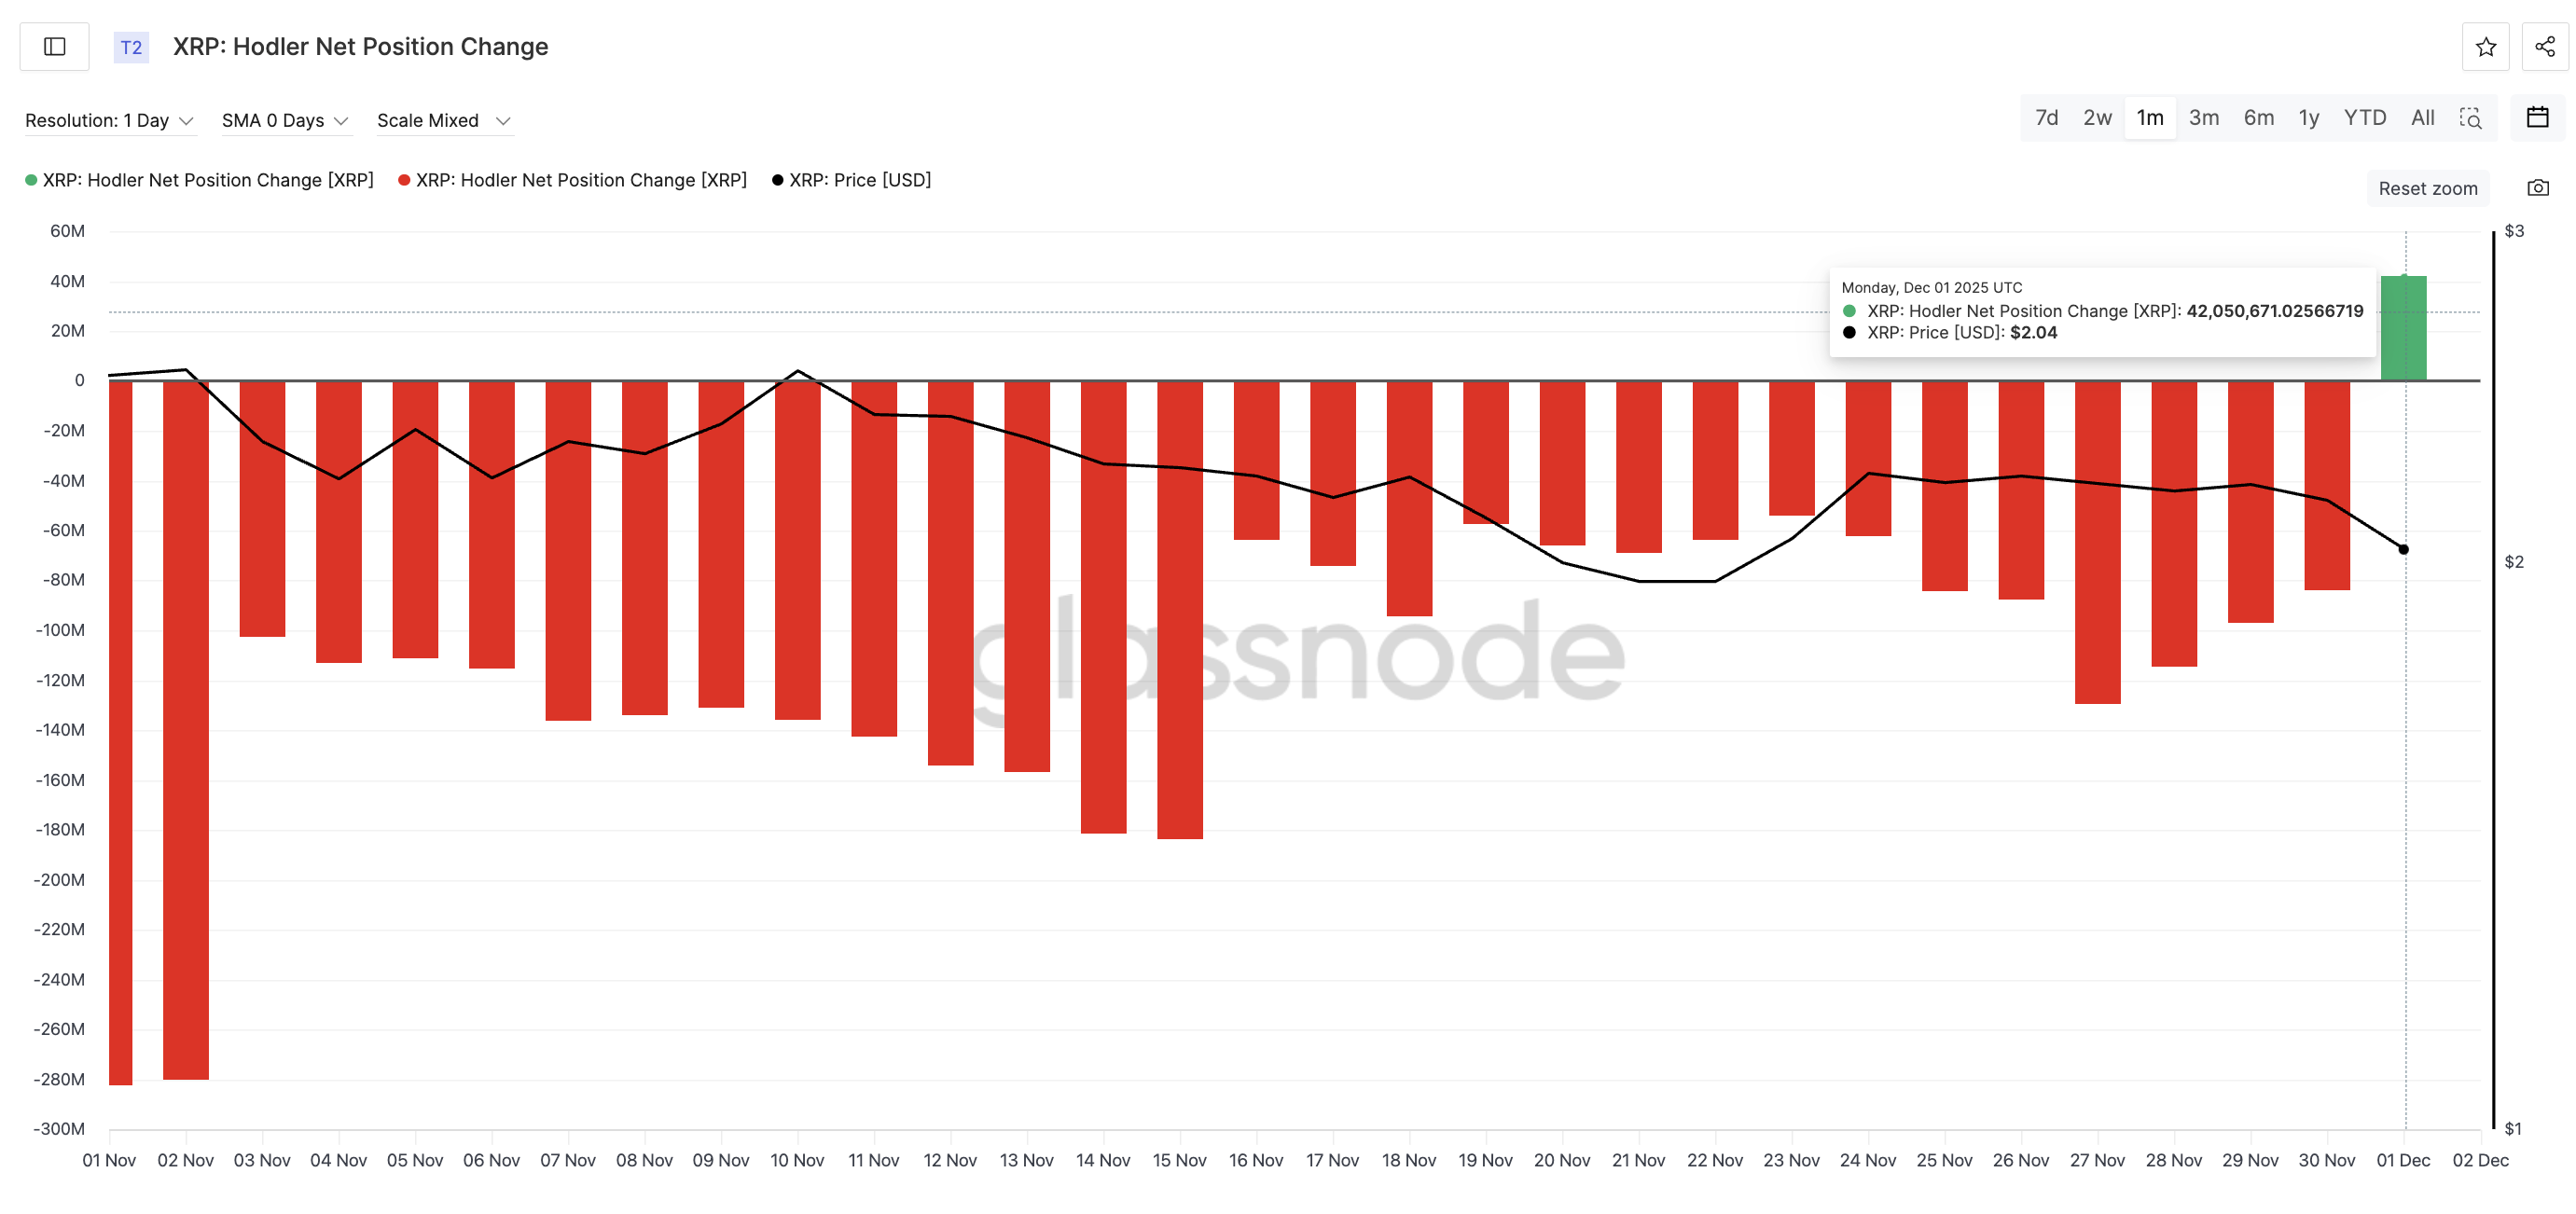
Holder Net Position Change Flips Green — A Rare Shift After 29 Days
One sudden and rare on-chain shift has now appeared.
The Holder Net Position Change tracks how long-term wallets add or remove tokens. Red bars mean they are sending tokens out (distribution). Green bars mean they are accumulating. For 29 straight days, this metric was red. XRP long-term holders were exiting every day.
On December 1, it flipped green for the first time in a month.
The metric moved from –83.9 million XRP on November 30 to +42.05 million XRP, which is roughly a 150% swing from net outflows to net inflows.
 XRP Holders Finally Start Buying:
Glassnode
XRP Holders Finally Start Buying:
Glassnode
This is the first clear sign that long-term investors are testing the support zone and could be preparing for a rebound attempt. That’s the rare hope we mentioned earlier.
XRP Price Levels: What Happens Next Depends on $1.94
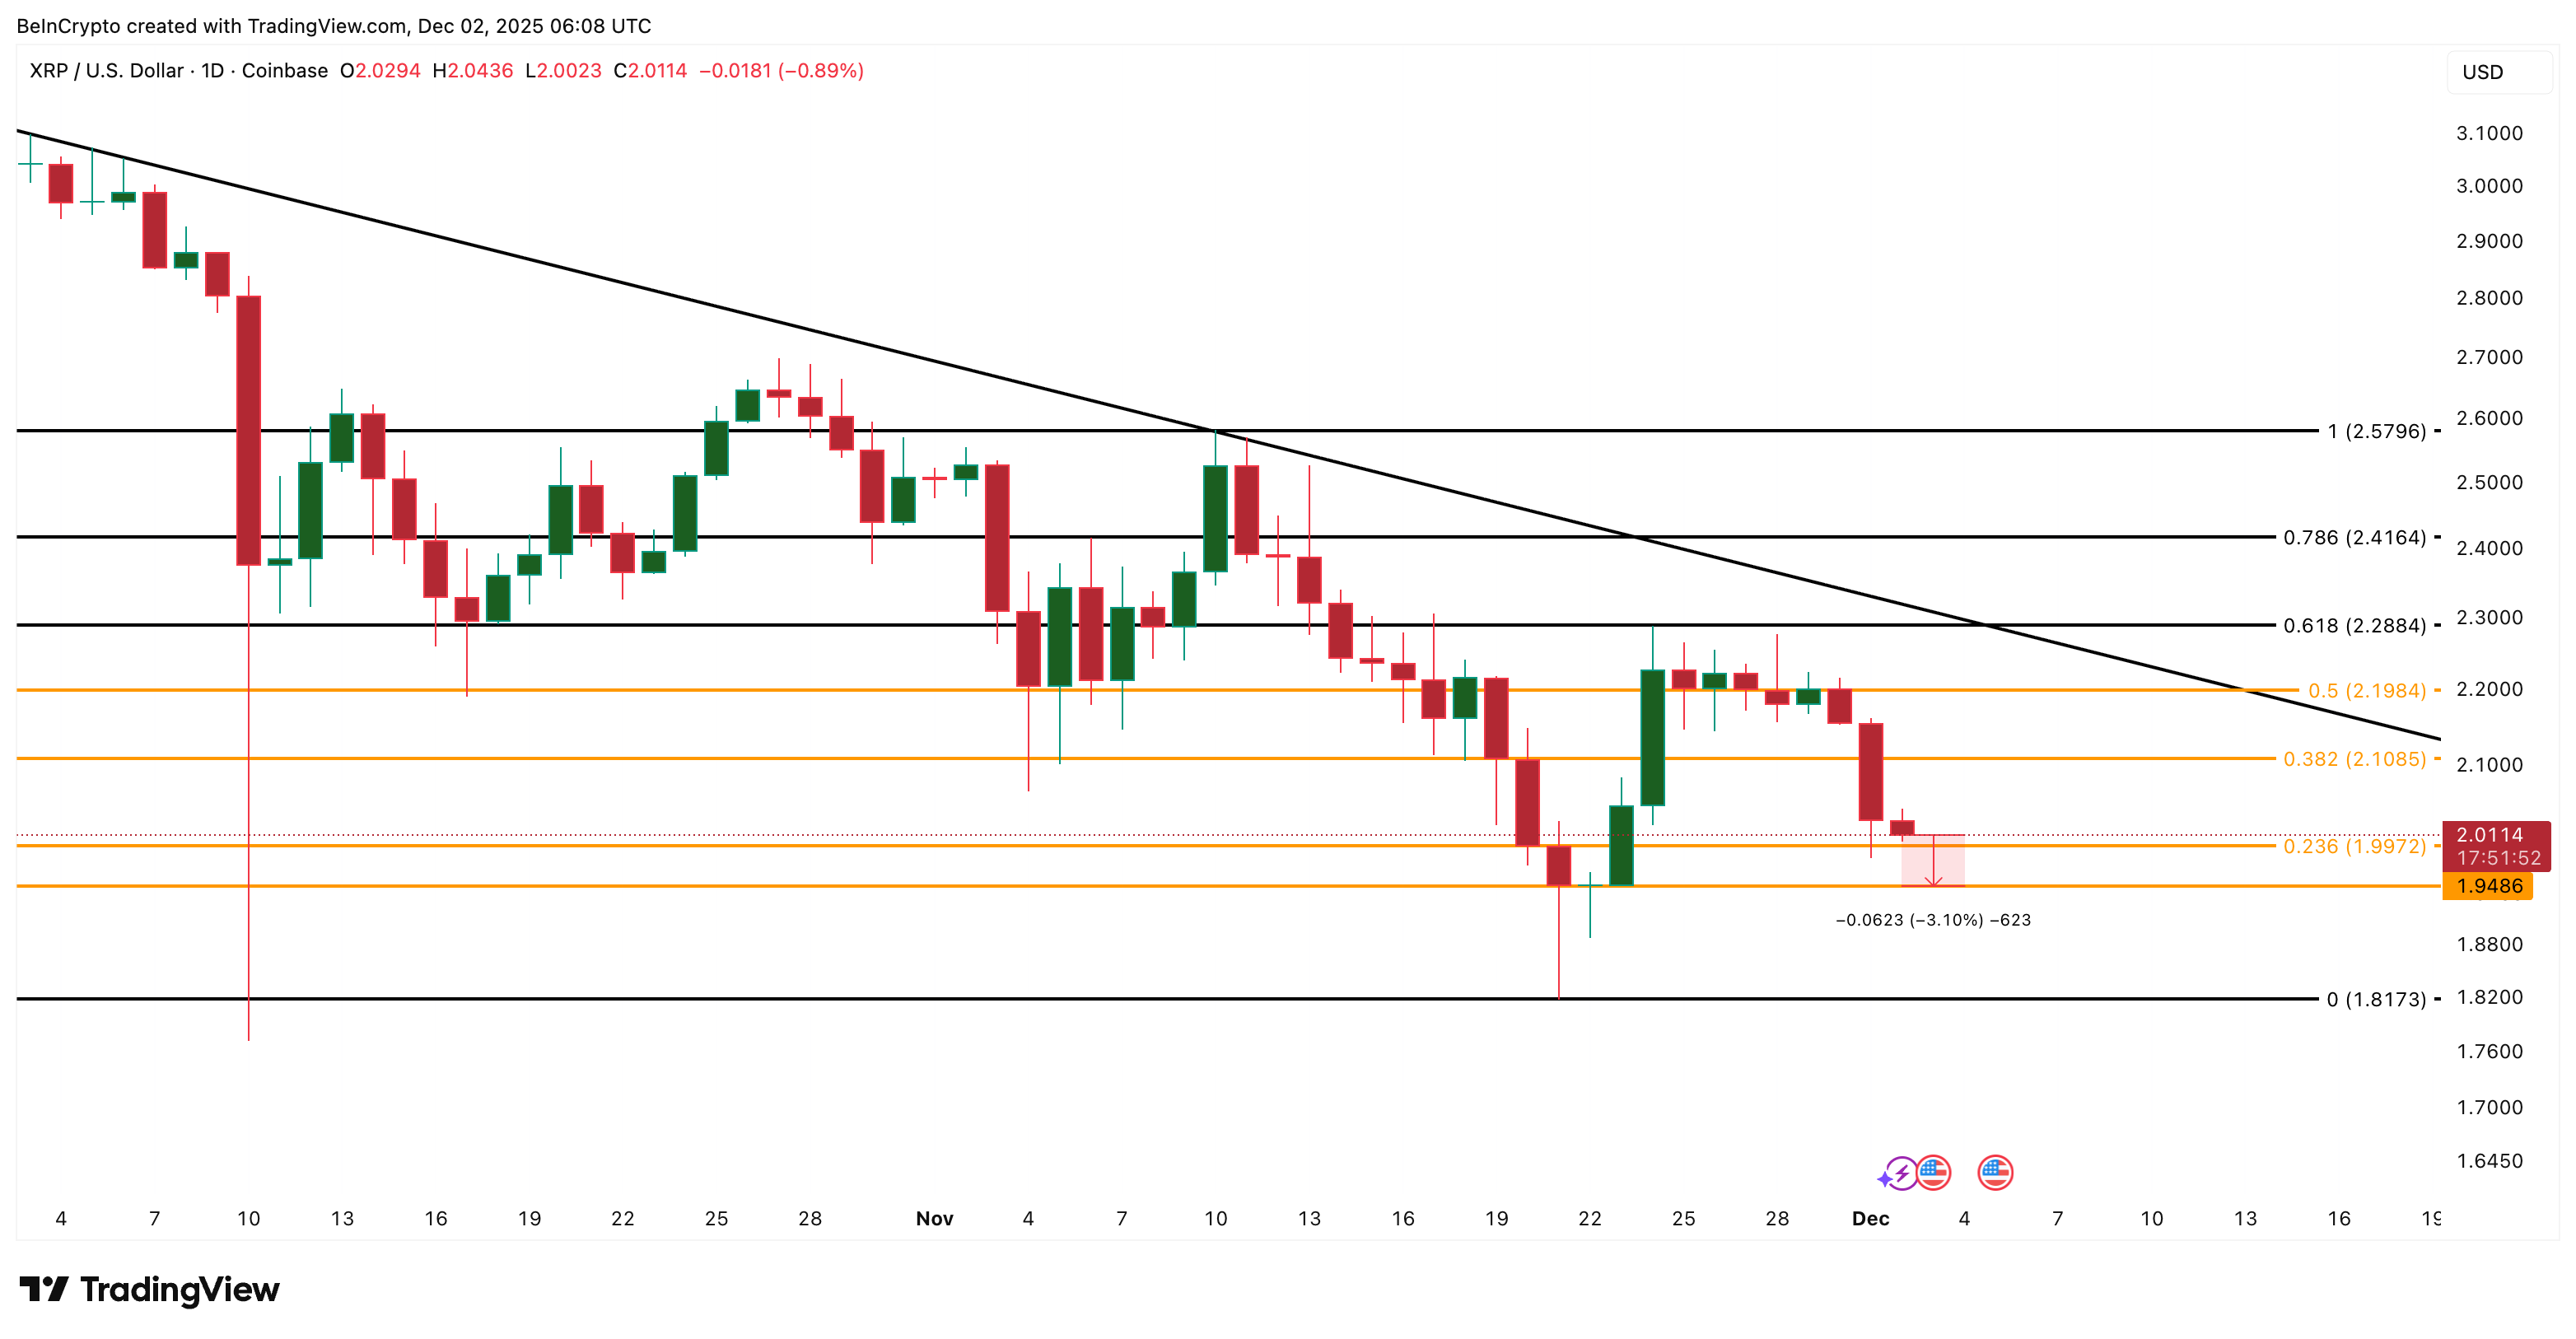
As mentioned, the XRP continues to move under a descending trend line. This trend line forms the upper boundary of the triangle, with Fibonacci levels acting as the base. The price has already broken through several levels. The first critical breakdown came under the 0.5 Fibonacci line near $2.19, followed by another under $2.10. The next key floors sit between $1.99 and $1.94.
A close below $1.94 confirms the breakdown. That would open the path toward $1.81, which is the next major support zone.
 XRP Price Analysis:
TradingView
XRP Price Analysis:
TradingView
If the long-term holders continue adding and the $1.94–$1.97 cluster holds, XRP could attempt a rebound.
The first recovery barrier sits at $1.99. The XRP price needs to hold above it to avoid a deeper correction.
A stronger rebound forms only if XRP can break above $2.28, which is where it would flip above the descending trend line and neutralize the constant sell pressure.
The XRP price is now pinned between its strongest near-term support and the trendline that provides resistance. Whether the new long-term accumulation is enough to stop a fresh breakdown will decide the next move.
Disclaimer: The content of this article solely reflects the author's opinion and does not represent the platform in any capacity. This article is not intended to serve as a reference for making investment decisions.
You may also like
Bitcoin and Solana ETFs See Inflows as Ethereum Stumbles
Bitcoin and Solana ETFs gain momentum while Ethereum ETFs face $75M in outflows.Ethereum ETFs Face Heavy OutflowsSolana ETFs Continue to Attract CapitalMarket Sentiment Shows Diverging Trends

Whales Accumulate ETH as Bitcoin Holds Near $90K
Bitcoin remains stable near $90K while whales quietly accumulate Ethereum at lower prices.Ethereum Becomes the Quiet FavoriteWhale Behavior Signals Bullish Outlook

Bitmine Buys 22,676 ETH Worth $68.67M
Bitmine, led by Tom Lee, has acquired 22,676 ETH worth $68.67M, signaling strong confidence in Ethereum's future.Ethereum: Still a Favorite for InstitutionsMarket Reactions and What’s Next

Mugafi Uses AVAX to Tokenize Entertainment IP
AI studio Mugafi taps into AVAX to tokenize and monetize entertainment IP, opening new doors for creators and fans.Empowering Creators and Engaging FansMugafi’s Vision for the Future of IP