HBAR Keeps Printing Bullish Divergences; Here’s Why This One Matters More

The HBAR price has fallen hard this week, yet a new bullish divergence has formed right at wedge support. This time, buying pressure from larger wallets is finally improving, giving the signal more credibility than earlier attempts. If the support line holds, HBAR may attempt a rebound. If it cracks, the pattern turns bearish and the decline can deepen.
The HBAR price is down almost 18.5% over the past seven days and remains weak on the monthly chart. Even with that decline, HBAR is still clinging to the lower boundary of a falling wedge that has been active since October 10. The wedge itself is a bullish pattern, but the structure is now under pressure.
What stands out today is that the bullish divergence has appeared again — but this time it may matter more.
Recurring Divergences Hint At A Bounce, But Break Risk Remains
The first signal comes from momentum. Between October 11 and November 16, HBAR formed a lower low on the chart while the Relative Strength Index (RSI) formed a higher low. RSI tracks buying strength, and this pattern is a standard bullish divergence. It shows sellers are losing control even though the price keeps slipping. When seen on a daily chart, this type of divergence often leads to trend reversals.
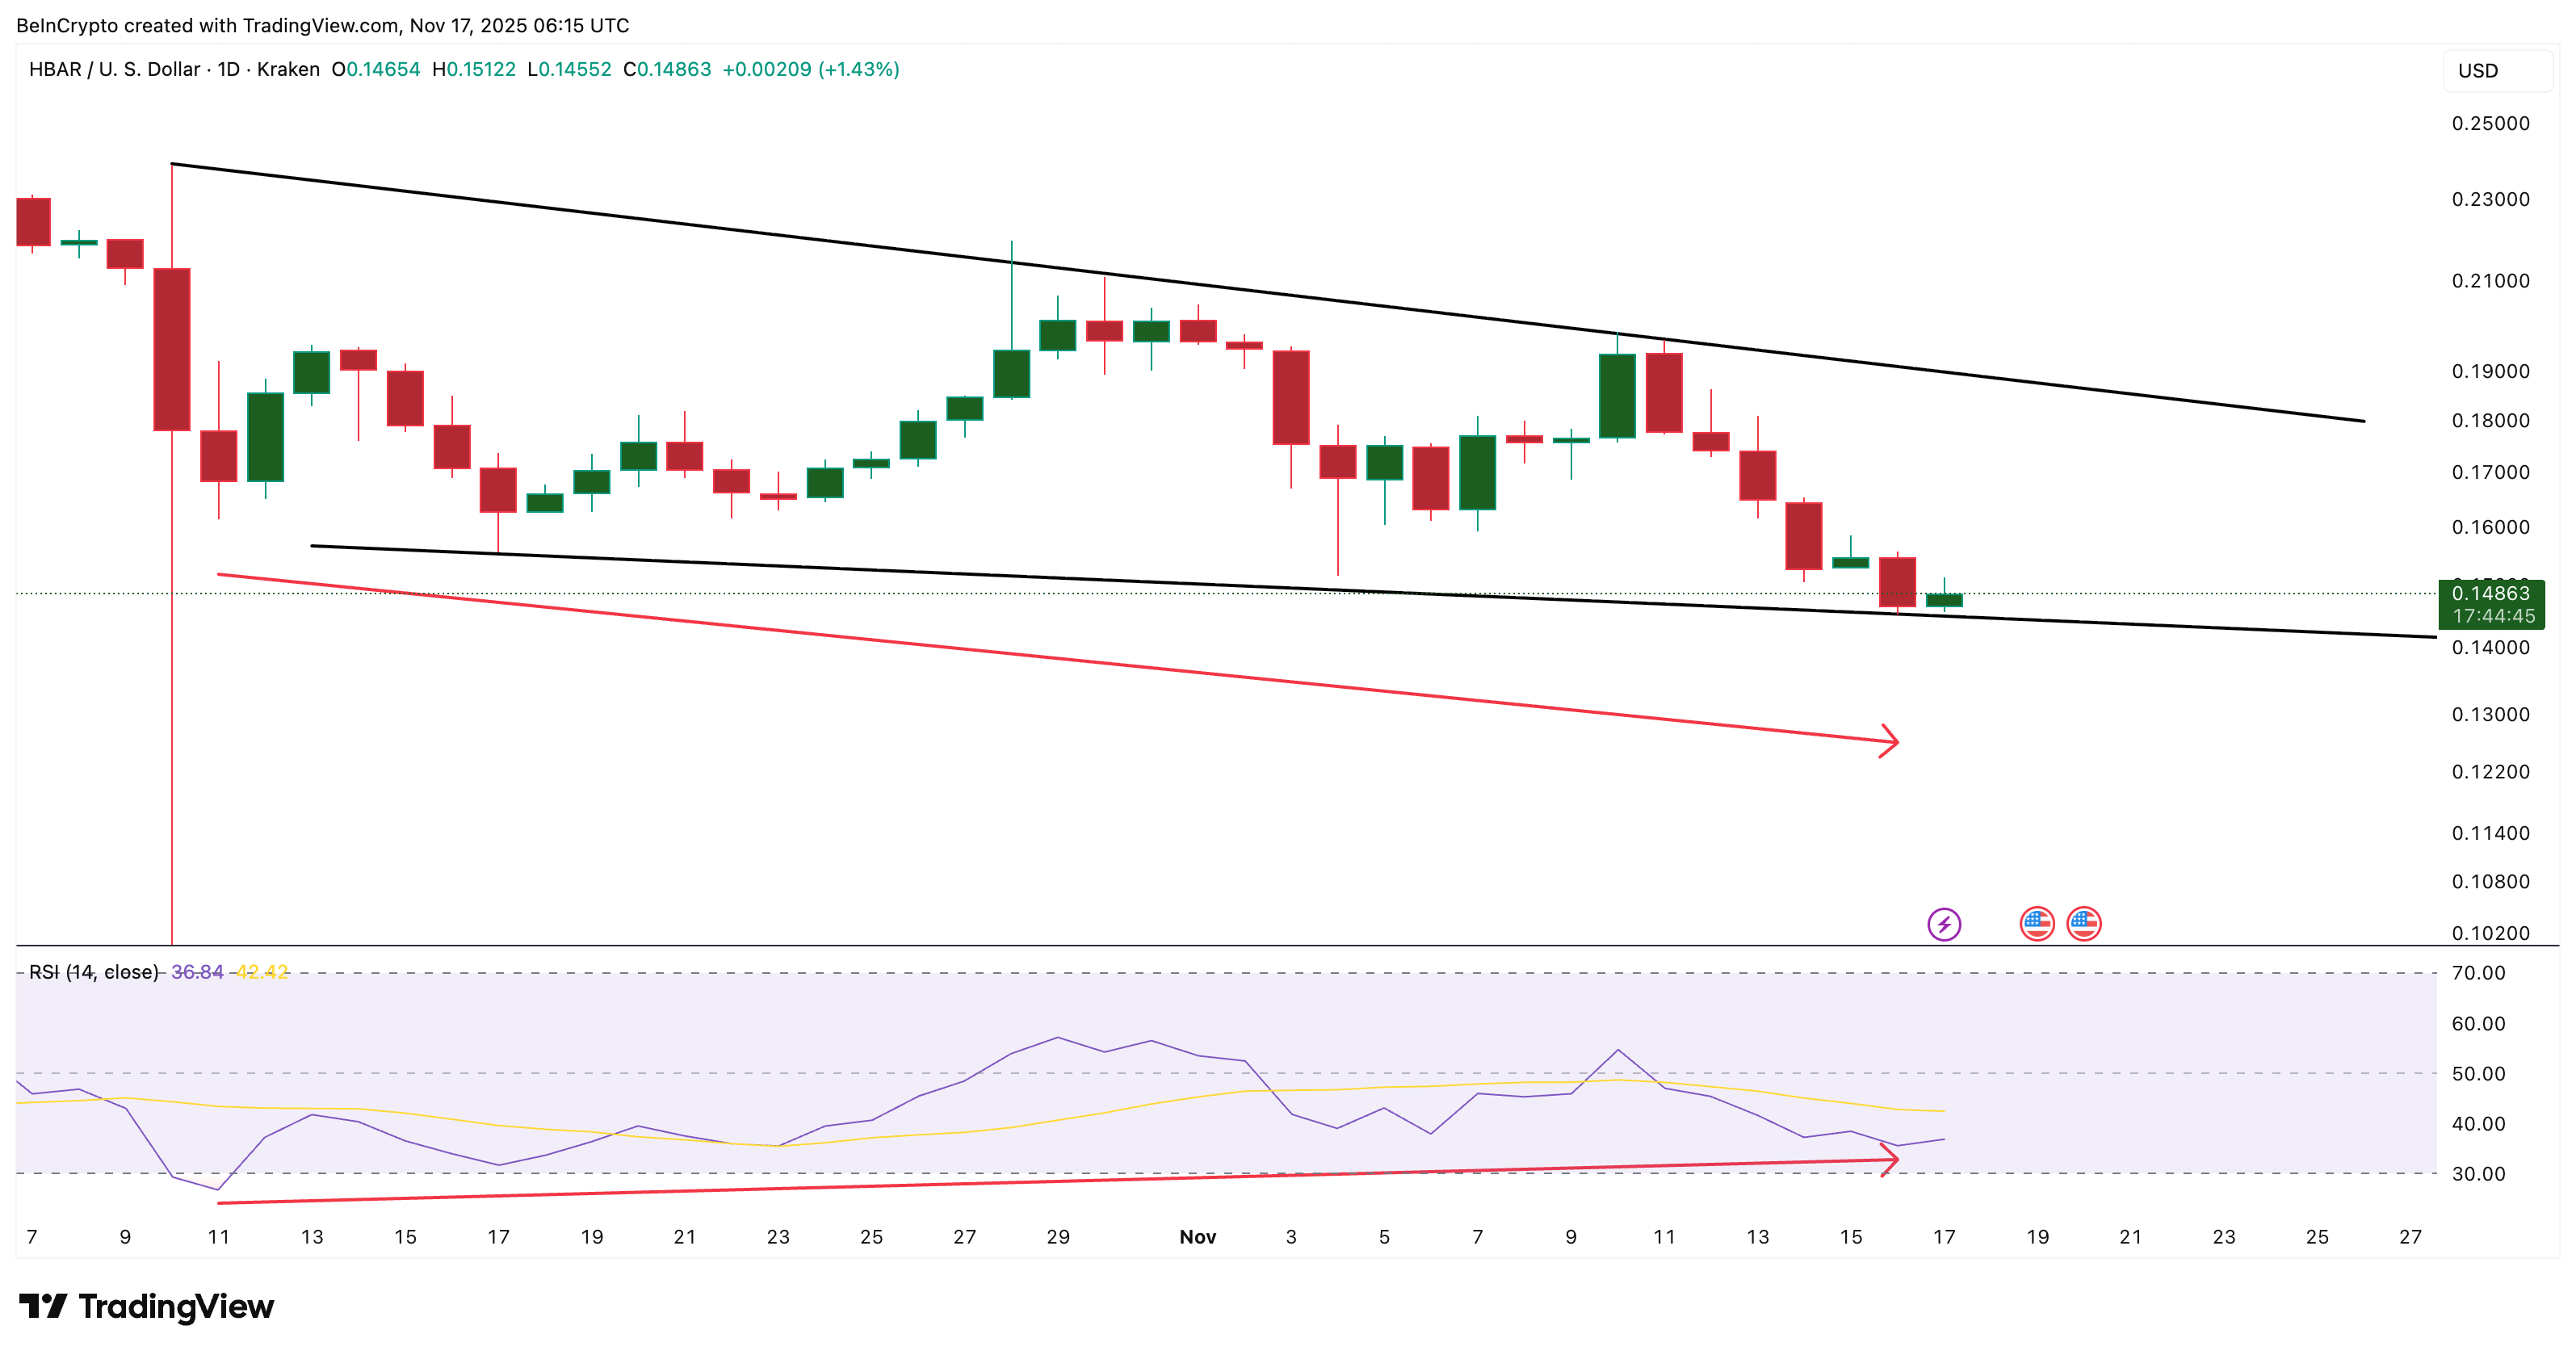 HBAR Price Flashes Bullish Divergence:
TradingView
HBAR Price Flashes Bullish Divergence:
TradingView
Want more token insights like this? Sign up for Editor Harsh Notariya’s Daily Crypto Newsletter here.
A similar divergence appeared earlier between October 11 and November 14, but that reversal or even a rebound attempt failed. The weakness in November explains why the HBAR price has been sliding toward wedge support again.
This time, the divergence appears right as the price sits on the last meaningful support inside the wedge. If the lower trend line holds, the setup has a better chance of playing out. But if HBAR closes under the trend line, the wedge breaks, and the price structure turns bearish.
Do note that the lower trend line only has two clear touchpoints, making the downside case stronger in case the market conditions weaken
Why This Divergence Matters More: Big Money Finally Reacts
The difference now comes from the Chaikin Money Flow (CMF). CMF tracks whether large wallets are adding or removing capital. Earlier rebound attempts failed because CMF continued to fall and never confirmed the RSI divergence.
This time, CMF has curled upward after declining steadily since November 10. As long as CMF holds above its trend line, the inflow signal supports the RSI divergence instead of contradicting it. That is why this divergence matters more than the previous one.
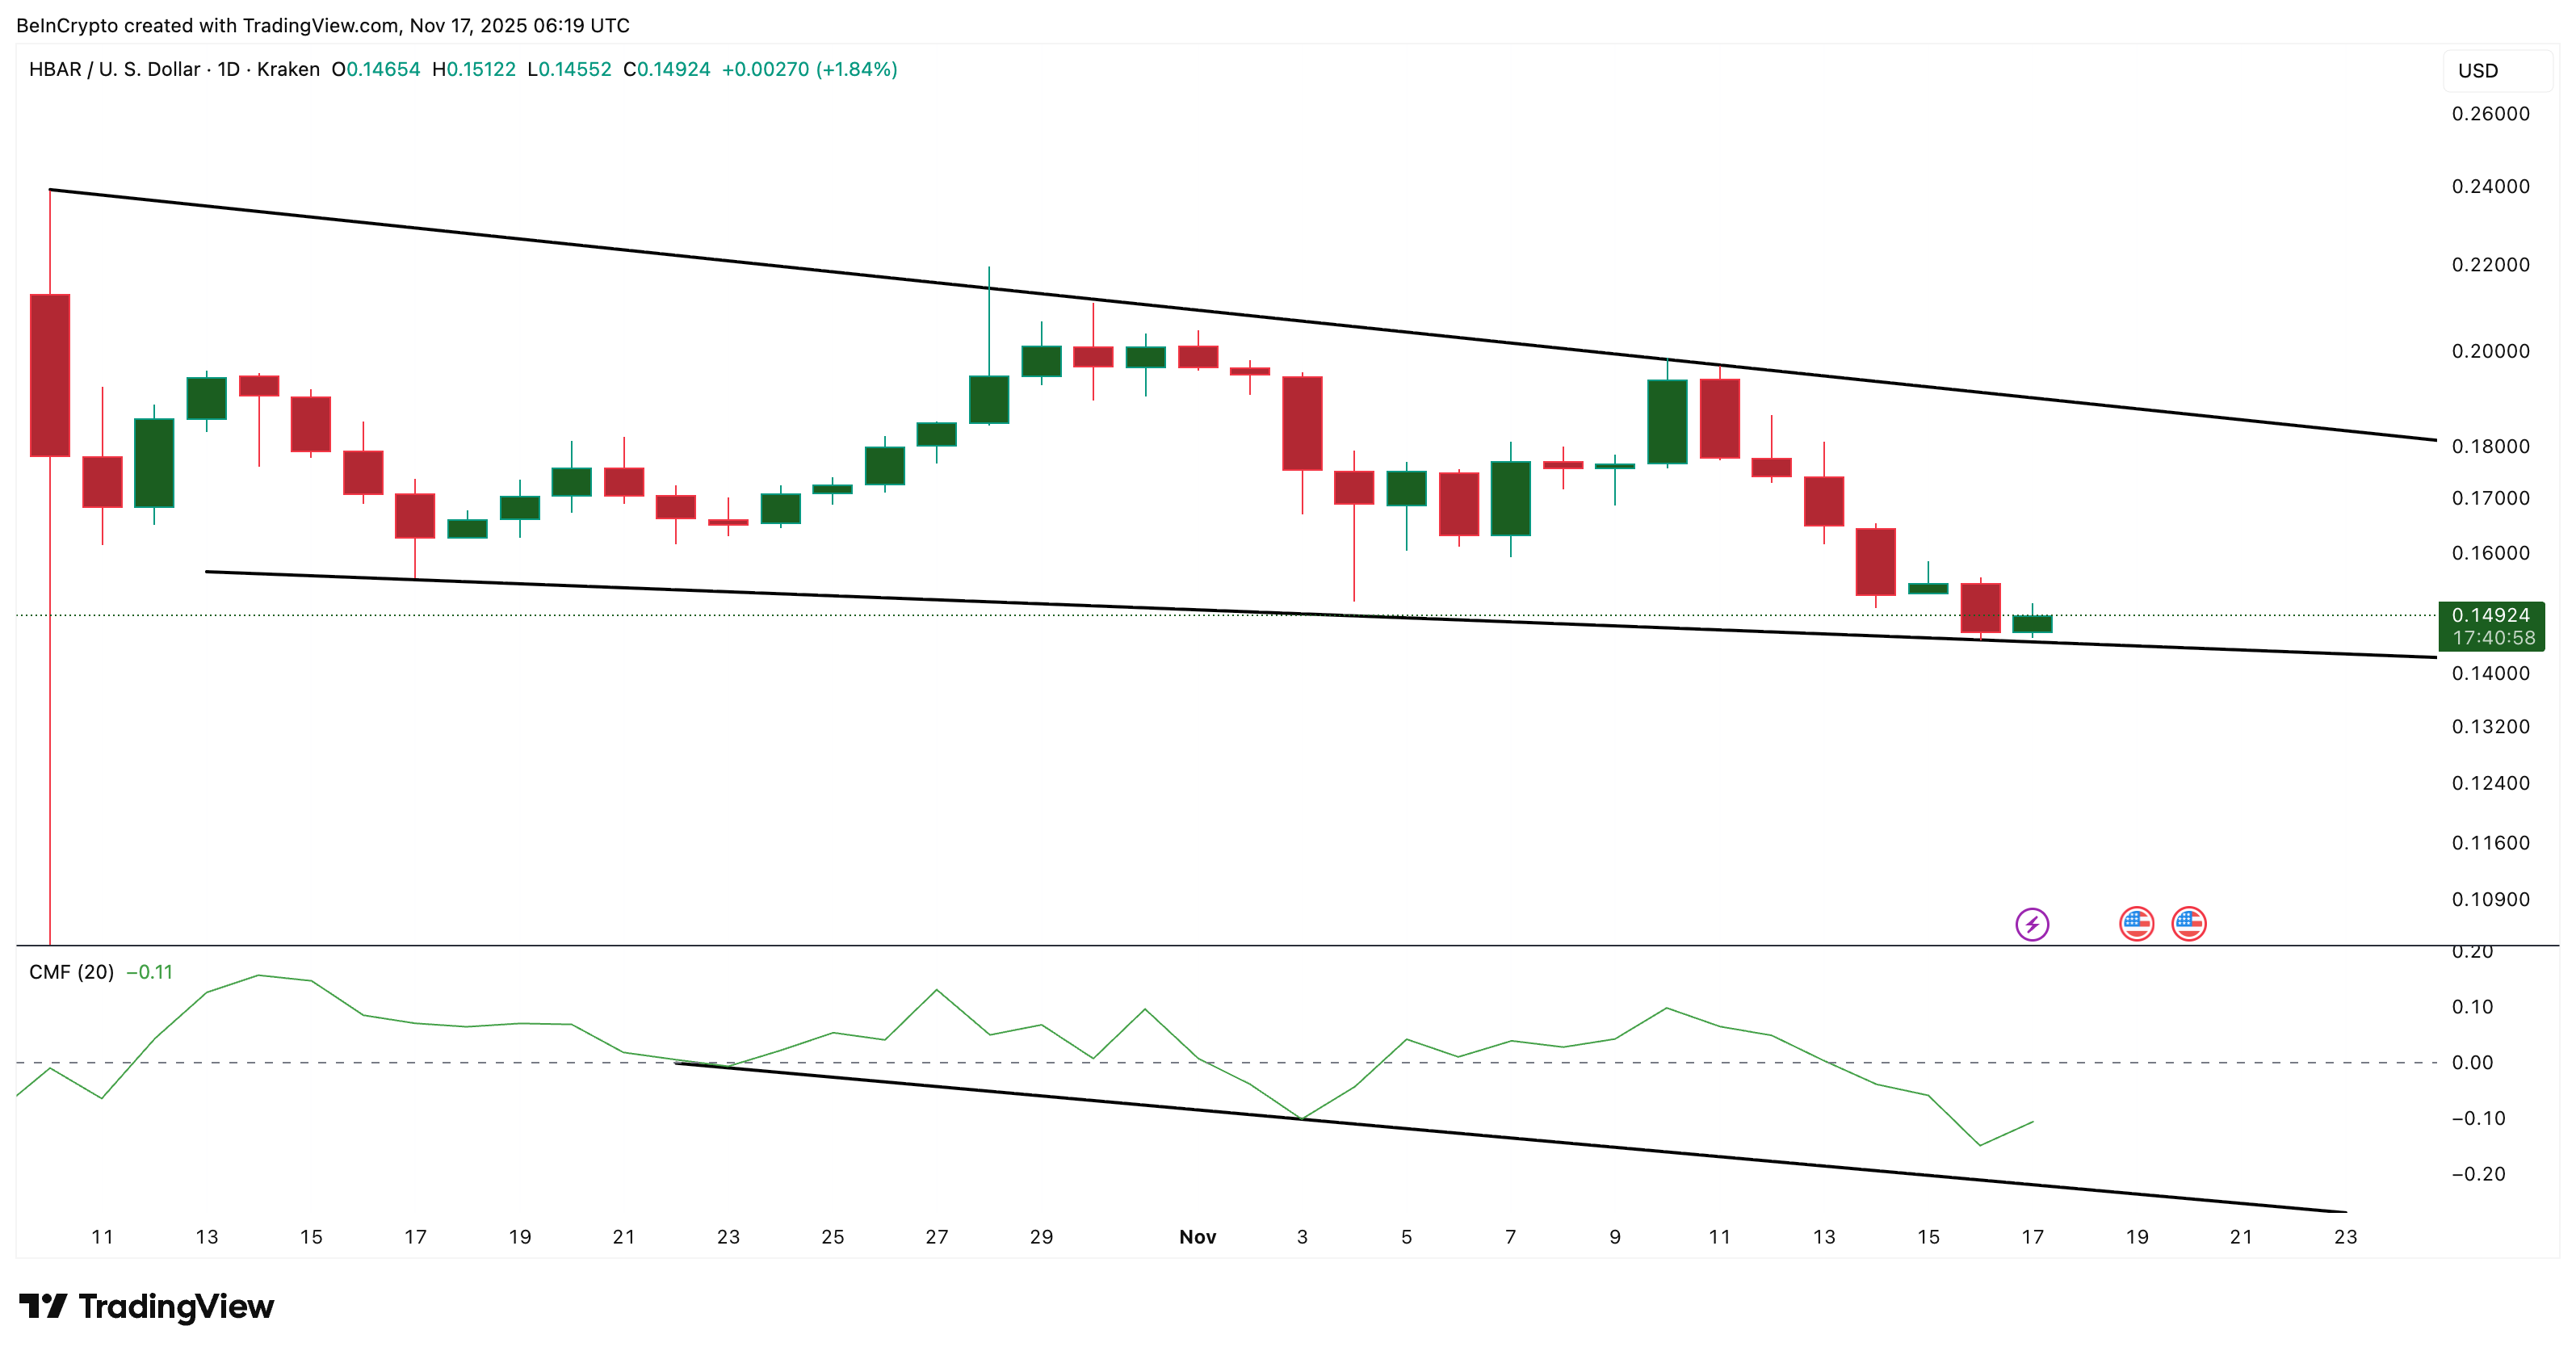 Big Money Starts To Flow In:
TradingView
Big Money Starts To Flow In:
TradingView
If both metrics stay aligned, the rebound structure strengthens for HBAR. If CMF turns lower again, the setup weakens immediately. However, the CMF needs to move above zero to confirm rebound (or even a reversal) strength.
HBAR Price Levels Hold The Key
The HBAR price stands at a key level. A daily candle close below $0.145 breaks the wedge and exposes deeper downside. Failure here sends the price toward lower supports and invalidates the bullish divergence.
To validate the rebound instead, HBAR must clear $0.165. That move is roughly a 10% rise and would confirm that buyers have stepped in after the divergence. A break above $0.165 opens the way toward $0.186, which sits near the wedge’s upper trend line.
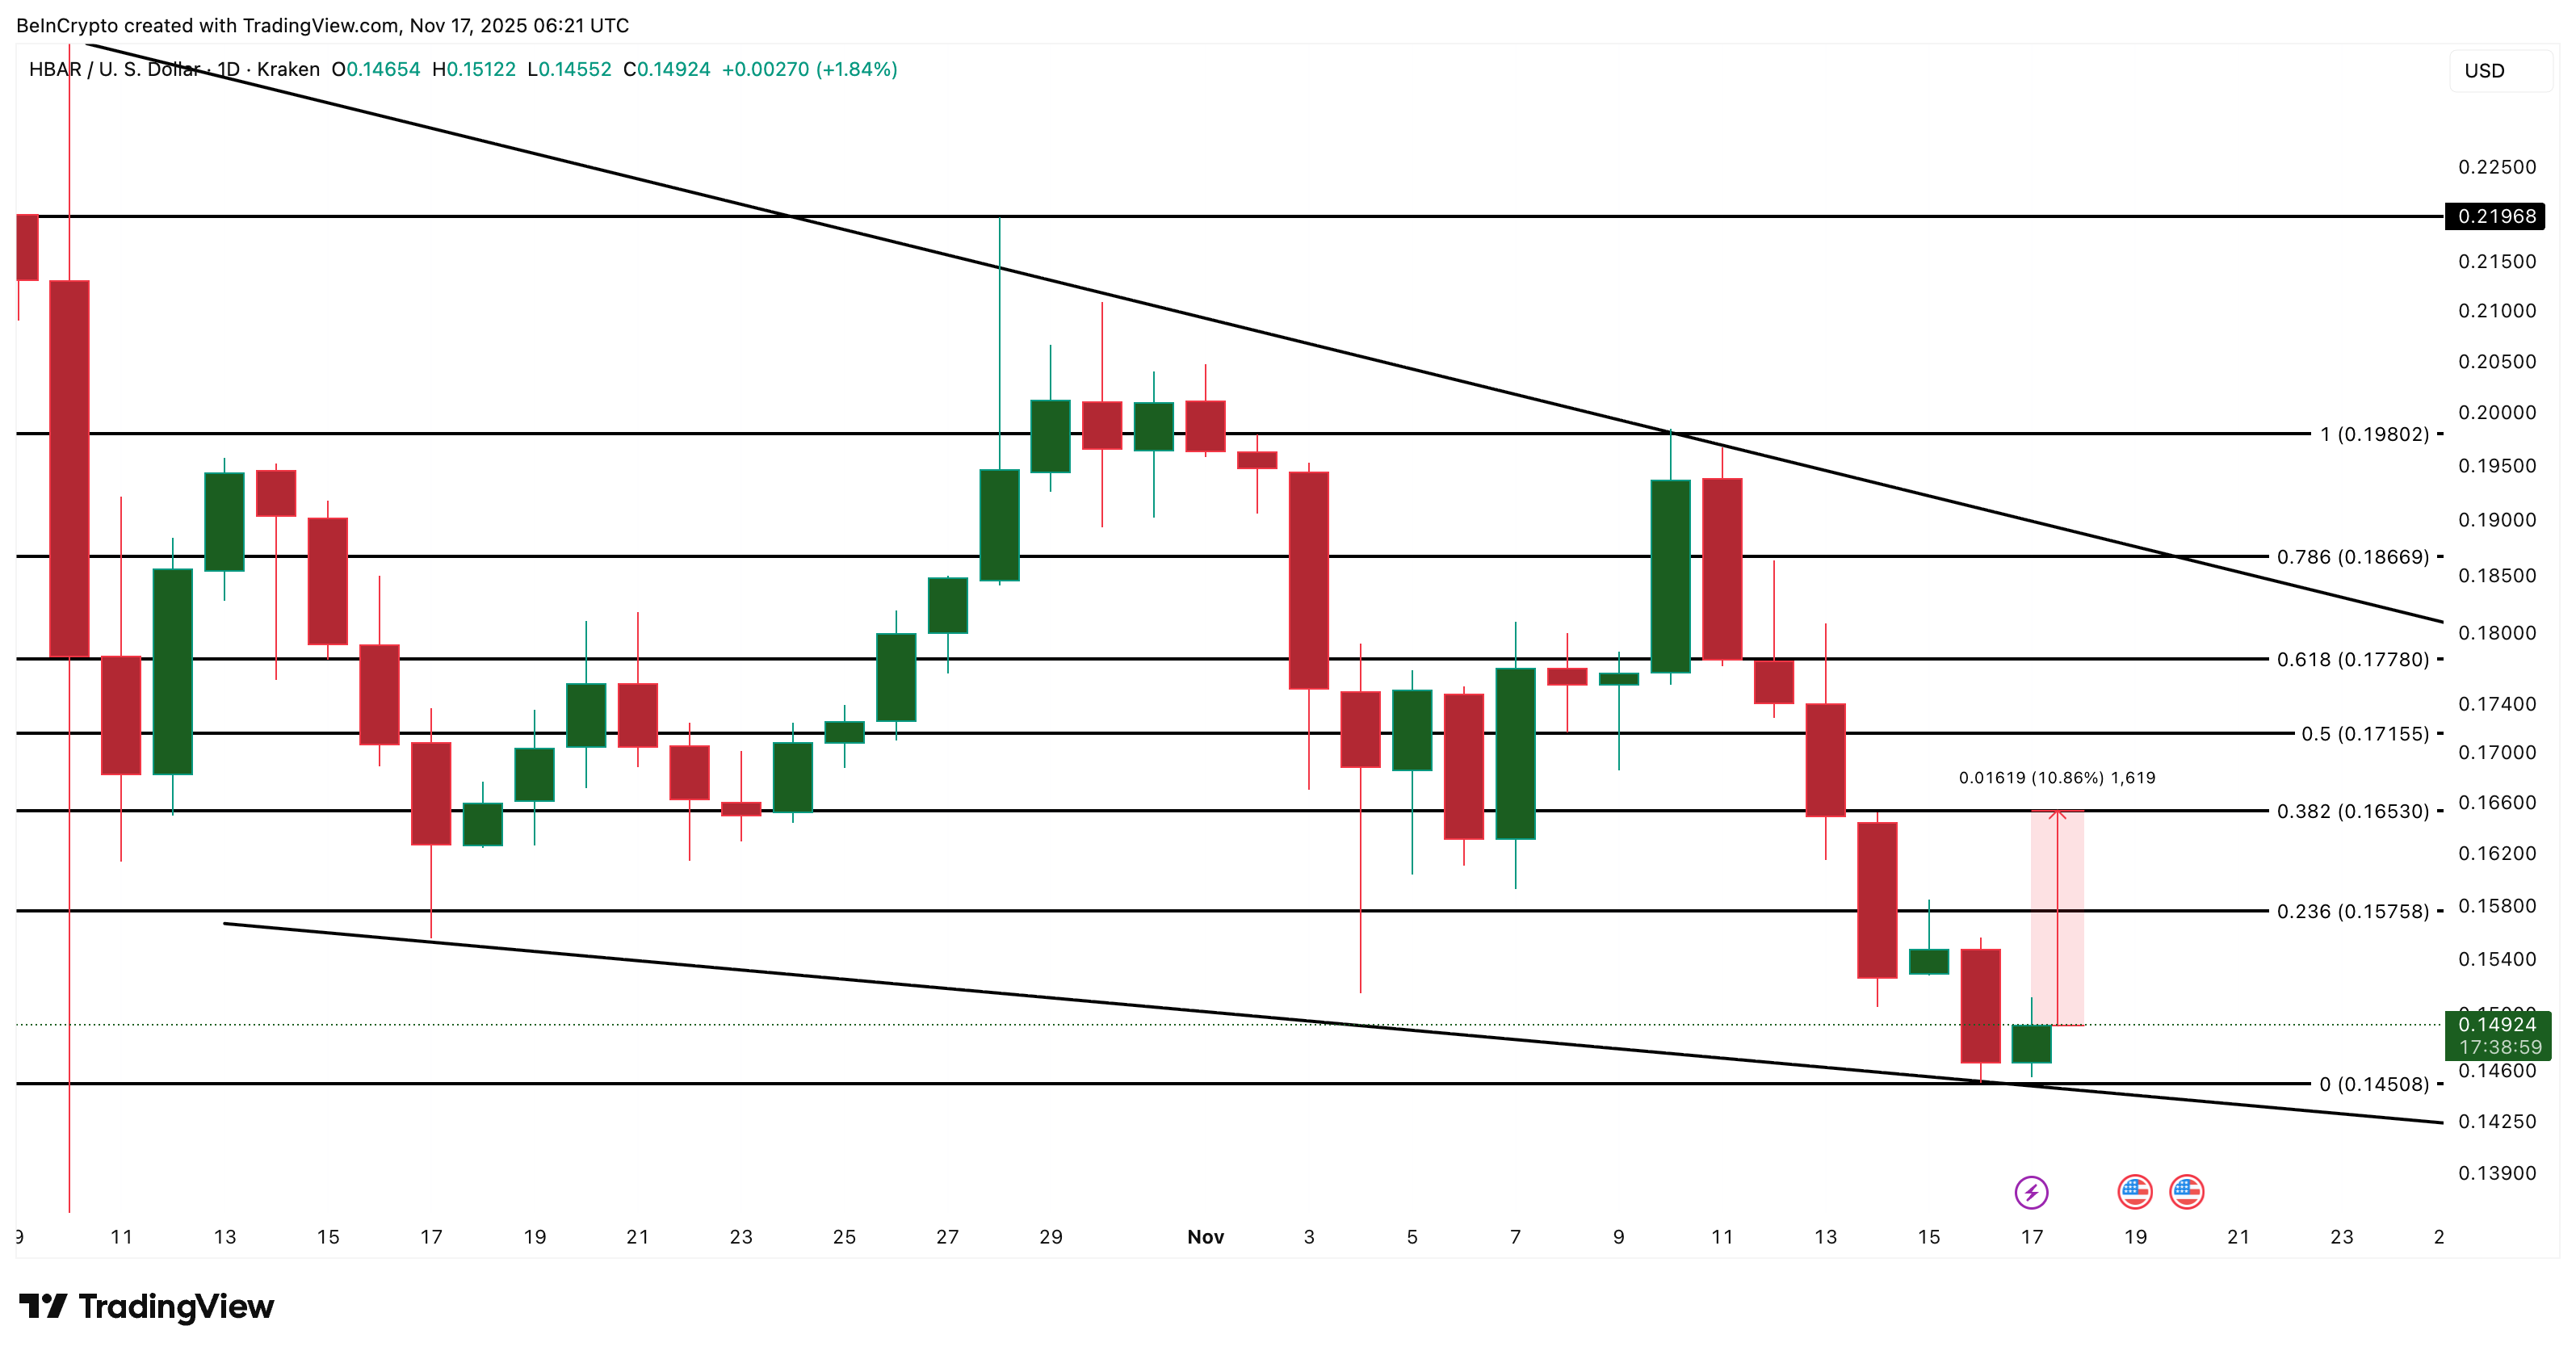 HBAR Price Analysis:
TradingView
HBAR Price Analysis:
TradingView
If $0.186 is reclaimed, the falling wedge breaks to the upside, and the HBAR price can attempt a move toward $0.219 or higher.
For now, everything depends on the wedge support holding. If it does, this latest bullish divergence — backed by rising CMF — may be the first one strong enough to matter.
Read the article at BeInCryptoDisclaimer: The content of this article solely reflects the author's opinion and does not represent the platform in any capacity. This article is not intended to serve as a reference for making investment decisions.
You may also like
Clean Energy Market Fluidity: Exploring Emerging Opportunities for Institutional Investors
- CleanTrade's CFTC approval as a SEF in 2025 revolutionized clean energy derivatives by centralizing trading, boosting liquidity to $16B in two months. - The platform standardized VPPAs and RECs under regulated frameworks, reducing counterparty risk and aligning renewable assets with traditional energy markets. - Institutional investors now access transparent, scalable tools for decarbonization, with 84% expecting increased sustainable asset allocations by 2027. - Regulatory alignment with ICE standards e

The Emergence of Hyperliquid and What Lies Ahead for Perpetual Trading Platforms
- Hyperliquid dominates 56% of decentralized perpetual trading volume in 2025 with $86.6M 30-day revenue, driven by HyperCore's on-chain CLOB and HyperBFT consensus. - Its sub-second finality and 200k orders/second capacity rival centralized exchanges while maintaining transparency, attracting institutional traders seeking compliance and security. - Strategic partnerships with Anchorage Digital and Circle's CCTP V2, plus a $888M strategies fund, reinforce institutional adoption aligned with U.S. and EU reg

COAI's Unexpected Price Decline: Causes, Impacts, and Potential Prospects?
- COAI token's nearly 90% drop from $44.90 to $2.18 in October 2025 driven by C3.ai's $116.8M loss, governance issues, and regulatory uncertainty. - Market fear index hit 10/100 as top wallets (88% supply control) accelerated selling, shifting capital to Binance Chain meme coins. - Technical indicators show oversold RSI (31.4) but broken key support levels, creating asymmetric risks for contrarian investors. - Regulatory ambiguity and governance flaws persist, with 30-day -92.6% decline highlighting struct