YFI Value Falls by 40.84% Over the Past Year Due to Market Fluctuations and Anticipated Interest Rate Reductions
- Yearn.finance (YFI) rose 0.23% in 24 hours to $4,754 but fell 40.84% in one year amid DeFi market instability. - Analysts warn macroeconomic uncertainty and lack of institutional adoption could further pressure YFI unless regulatory clarity emerges. - YFI's weak performance reflects broader DeFi struggles, with shrinking market cap and no clear technological upgrades to drive recovery. - Technical indicators remain unreliable for YFI due to high volatility, complicating efforts to identify meaningful sup
On October 25, 2025, Yearn.finance (YFI) saw its price rise by 0.23% over the previous day, reaching $4,754. Despite this short-term gain, the token has faced substantial losses over longer periods, falling 2.07% in the past week, 12.09% over the last month, and dropping 40.84% in the past year. These numbers highlight the persistent volatility in the DeFi sector, especially for assets with high price swings and limited uptake of institutional-level infrastructure. Experts suggest that ongoing global economic uncertainty and changes in investor sentiment could continue to weigh on
In recent months, the DeFi sector has delivered mixed results, with YFI’s price trends closely mirroring those of the broader cryptocurrency market. While
Technical analysis tools like moving averages and the relative strength index (RSI) have often failed to give dependable signals for YFI, largely due to its extreme price volatility and occasional lack of liquidity. Still, market observers continue to use these indicators to pinpoint possible support and resistance zones, hoping to determine whether the latest decline could be a buying opportunity or signals a continued downward trend. Although these tools are not always accurate, they remain widely used for analyzing price movements when there is no clear fundamental driver.
Disclaimer: The content of this article solely reflects the author's opinion and does not represent the platform in any capacity. This article is not intended to serve as a reference for making investment decisions.
You may also like
Grasping the Factors Leading to Solana's Recent 50% Decline in Value
- Solana's 50% price drop in early 2025 stemmed from token unlocks, declining network activity, and the Libra meme token collapse. - Network metrics like active addresses (-40%) and TVL ($2.87B loss) revealed weakening ecosystem trust and liquidity. - Broader crypto market declines (Bitcoin to $86K) and macroeconomic risks accelerated Solana's sell-off amid rising trade war fears. - $500M liquidity migration to Ethereum and institutional ETF launches signaled cautious optimism despite ongoing volatility. -
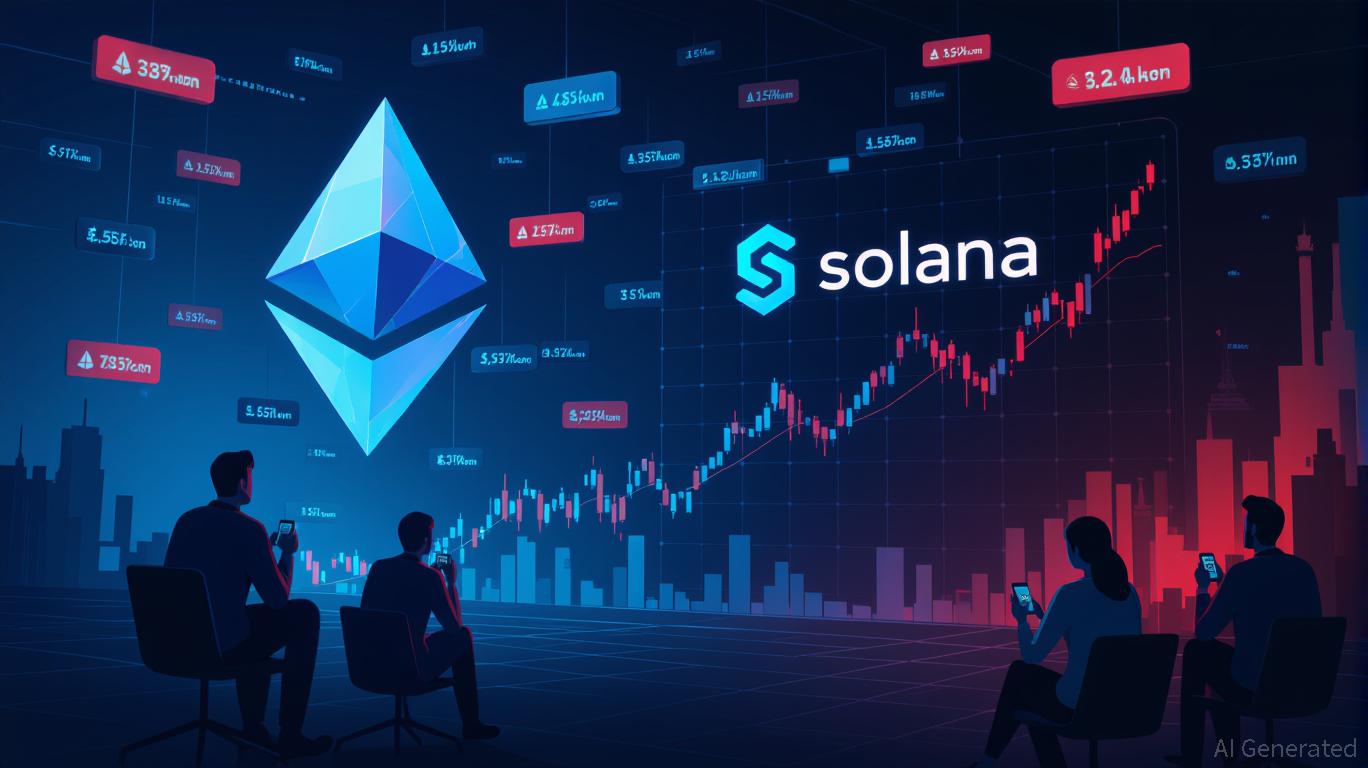
Evaluating Solana’s Recent Price Fluctuations in Response to Network Enhancements and Changing Market Sentiment
- Solana's 2025 upgrades (Firedancer, Alpenglow) enhanced throughput, decentralization, and block finality, supporting mainstream financial operations. - Price volatility (19% drop to $132) reflected market fear, but whale accumulation and ETF launches signaled institutional confidence in long-term potential. - Macroeconomic pressures and regulatory scrutiny tempered speculative demand, while on-chain metrics showed diverging NVT ratios and declining retail participation. - Investors face a cautious opport
Bitcoin Leverage Liquidation: Unseen Dangers Amid Crypto Market Fluctuations
- Q3 2025 saw $19B in Bitcoin leveraged trading liquidations, driven by cascading ADL mechanisms on major exchanges. - Overleveraged retail investors and DATCos amplified volatility through forced selling, exposing systemic fragility in crypto markets. - Behavioral biases like herd mentality and overconfidence worsened instability, with social media fueling impulsive trading decisions. - Institutions adopted risk-mitigation strategies while regulators tightened oversight, but gaps persist in monitoring opa
SHIB Eyes a Major Lift as the 2026 Privacy Upgrade Approaches