Bitcoin’s Fear Index Hits 44, Mirroring 2020’s ‘Extreme Fear’ Before Market Rebound
- Bitcoin Fear and Greed Index dropped to 44 on Sept 25, 2025, entering "Fear" territory as volatility and cautious sentiment dominate. - Index combines volatility (25%), social media (15%), and Bitcoin dominance metrics, reflecting market psychology near $12,600 price level. - Historical parallels to 2020's "Extreme Fear" (index <20) suggest potential buying opportunities, though current 44 reading lacks immediate reversal signals. - Contrarian strategies remain relevant, but require caution as regulatory
The
This downward move comes after a recent downturn in the crypto sector, where increased liquidations in derivatives and heightened price swings have added to investor anxiety. Nevertheless, open interest in Bitcoin futures remains steady, indicating ongoing speculative involvement. Experts observe that periods of fear can sometimes signal a market reversal. For instance, during the March 2020 crash, the index plunged to "Extreme Fear" (below 20), which was followed by a strong rebound. Although the current level of 44 is not as low, it fits with past trends where significant fear often preceded market recoveries.
The index’s calculation method emphasizes the influence of several elements. Volatility makes up 25% of the score, with recent price fluctuations in Bitcoin contributing to the fearful outlook. Social media sentiment, which accounts for 15%, is also factored in, as a drop in optimistic posts and a rise in cautious commentary online mirror broader market unease. Furthermore, Bitcoin’s share compared to altcoins—making up 10% of the index—has shifted slightly, suggesting that some investors may be moving to safer assets amid uncertainty. CoinMarketCap’s own index, which includes derivatives data like put/call ratios, supports the current bearish sentiment.
Historically, fear indicators have acted as both warnings and opportunities. During the 2020 market crash, the index’s fall to 15 ("Extreme Fear") coincided with Bitcoin losing half its value, but it also marked a buying opportunity for those with a long-term view. Similarly, in the 2022 bear market, the index entered fear territory before a slow recovery began. However, the present situation is different, as Bitcoin’s price has not yet seen a major double-digit drop. This implies that while fear is evident, it may not yet be strong enough to trigger a significant reversal.
For those investing, the index offers a layered view of market mood. Historically, contrarian approaches—purchasing during fearful periods and selling during greedy ones—have been profitable, though timing is crucial. The current score of 44 could be seen as a possible entry point for those optimistic about Bitcoin’s future. Still, the index should not be relied upon alone. Other factors, such as technical indicators, economic conditions, and regulatory changes, also play a role in shaping the market. For example, the recent failures of smaller crypto companies and increased regulatory attention in major markets have added complexity to sentiment analysis.
The wider crypto market continues to experience instability. While Bitcoin’s price has remained relatively steady lately, altcoins have been much more volatile, with some experiencing sharp declines. This contrast underscores the fragmented sentiment across the crypto landscape, where Bitcoin’s dominance and institutional interest stand in contrast to the speculative nature of smaller tokens. The Fear and Greed Index, by focusing on Bitcoin, provides insight into the market’s leading asset, but may not fully reflect the broader ecosystem’s dynamics.
As the index nears the lower end of the "Fear" spectrum, market watchers will focus on key price points and broader economic triggers. A sustained move below 25 could prompt more aggressive contrarian buying, while a rise above 47 might signal renewed optimism. For now, the 44 reading highlights the market’s ongoing volatility and the significance of sentiment in guiding decisions within a sector still evolving in terms of institutional participation.
Disclaimer: The content of this article solely reflects the author's opinion and does not represent the platform in any capacity. This article is not intended to serve as a reference for making investment decisions.
You may also like
Cryptocurrency Price Fluctuations and Technical Strategies in the Market After 2025: Assessing Immediate Momentum and Approaches to Risk Control for Tokens Such As
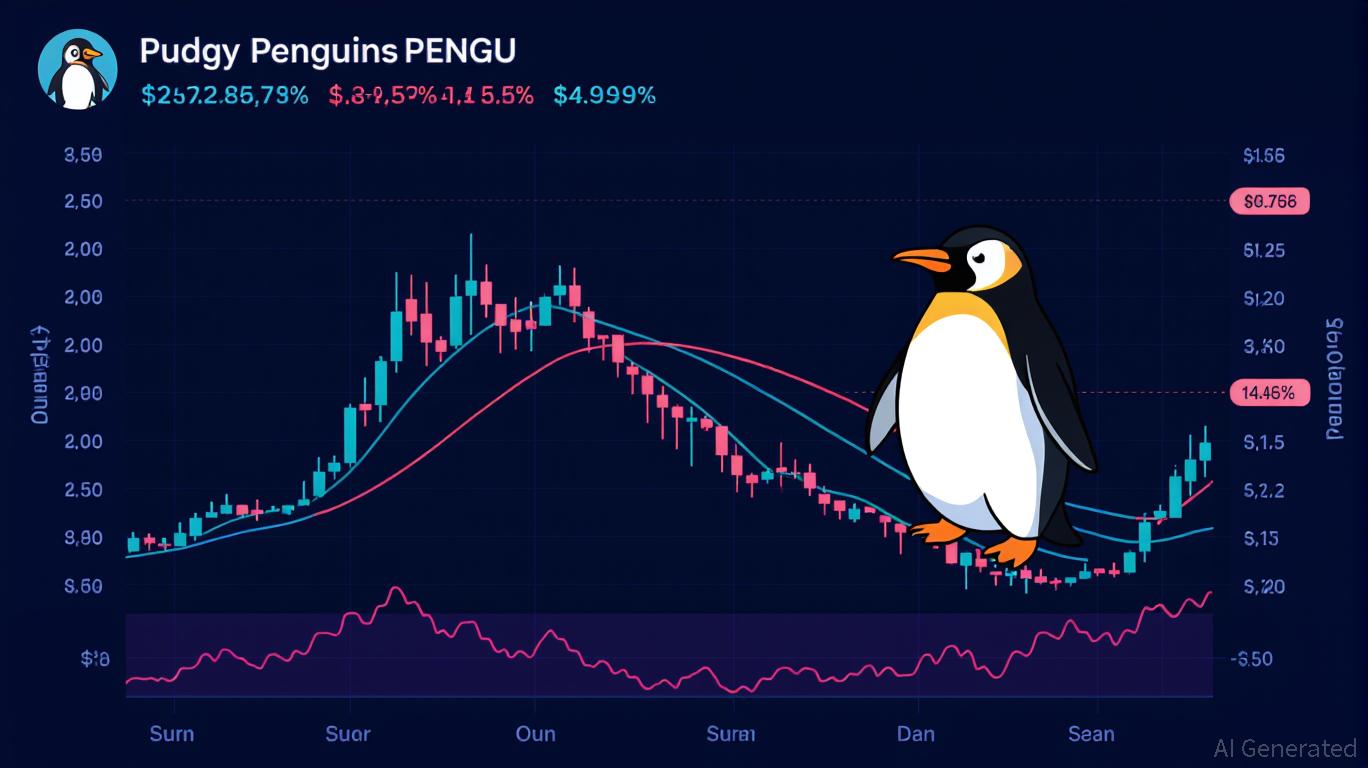
- Pudgy Penguins (PENGU) exhibits extreme 2025 volatility, surging 25% then retreating 30%, with 14.46% volatility metrics highlighting crypto market instability. - Technical indicators show conflicting signals: 4-hour bullish momentum vs. daily bearish patterns, while institutional inflows ($430k) contrast with bearish sentiment (Fear & Greed Index at 28). - Risk management is critical as PENGU faces key thresholds ($0.010 support, $0.014 resistance), with potential for $0.069 rebound or $0.008645 decline
Crypto Presale Activity Spikes Ahead of FED Decision: Mono Protocol and Nexchain Lead the Watchlist

Hyperliquid (HYPE) Price Fluctuations and Key Drivers: Understanding Market Emotions and Liquidity Challenges in DeFi
- Hyperliquid (HYPE) faces liquidity risks amid $372M TVL and 0.89 Bitcoin price correlation, exposing it to systemic crypto downturns. - Institutional confidence grows as Nasdaq-listed Hyperliquid Strategy stakes $420M HYPE tokens, reducing short-term selling pressure. - Market analysis shows HYPE rebounding to $33.84 with 8.8% 24-hour gains, but $37 resistance remains critical for bullish momentum validation. - Speculative trading patterns reveal mixed signals: 40% restaked tokens indicate conviction, wh
The Cultural Dynamics of Technology: How Insights into Society Drive Innovation and Investment Achievements
- Cultural anthropology is reshaping tech innovation by integrating human behavior insights into AI design, education, and investment strategies. - STEM programs at institutions like Morehouse and Howard use culturally responsive curricula to boost Black student retention and drive inclusive innovation. - Mentorship initiatives like AUGMENT and Google's programs link cultural intelligence to 2-3x higher success rates in tech transformations, generating $4.50 ROI per dollar invested. - AI-first companies em