Smart Money Exits Pi Network — Is a Deeper Crash Coming?
 2025/07/07 02:00
Pi Network has flipped the $0.47 level from support to resistance, signaling growing selling pressure and a weakening bullish effort.
The token remains under heavy bearish pressure, with seasoned investors losing confidence in any near-term price recovery.
Bearish Clouds Thicken Over PI
Readings from the PI/USD one-day chart reveal that since the altcoin closed at $0.46 on July 4, it has failed to initiate a break above this price level. This former support floor has now flipped into a resistance zone that PI appears to be struggling to breach as demand falters.
PI’s extended decline has pushed its price significantly below the Leading Spans A and B of its Ichimoku Cloud, reflecting the bearish sentiment among its holders. These lines now form dynamic resistance levels above PI’s price at $0.51 and $0.63, respectively.
 PI Ichimoku Cloud. Source:
TradingView
PI Ichimoku Cloud. Source:
TradingView
The Ichimoku Cloud tracks the momentum of an asset’s market trends and identifies potential support/resistance levels. When an asset trades above it, the price is in a strong bullish trend. The area above the Cloud is a bullish zone, indicating that market sentiment toward the asset is positive.
However, as with PI, when an asset’s price falls below the Cloud, it signals a strong bearish trend. It means sellers are in control, and upward momentum is limited.
In addition, PI’s Smart Money Index (SMI) has persistently declined since June 25. As of this writing, the indicator is at 1.22, dipping 9% since then.
 PI SMI. Source:
TradingView
PI SMI. Source:
TradingView
An asset’s SMI tracks the activity of experienced or institutional investors by analyzing market behavior during the first and last hours of trading.
When the indicator rises, it suggests increased buying activity by these investors, signaling growing confidence in the asset.
On the other hand, when it falls like this, there is high selling activity and reduced confidence from experienced investors. This highlights the lack of belief among key token holders in a near-term PI price recovery.
PI on the Brink: Will Bears Drag It to All-Time Lows?
The ongoing weakness across technical indicators paints a cautious picture for investors hoping for a swift rebound. If the bears strengthen their hold on the market and PI selloffs increase, the price could break below the newly formed support floor at $0.44 and plunge toward its all-time low of $0.40.
 PI Price Analysis. Source:
TradingView
PI Price Analysis. Source:
TradingView
However, an uptick in demand could prevent this. If new buyers enter the market, PI could break above $0.47 and soar to $0.50.
Disclaimer: The content of this article solely reflects the author's opinion and does not represent the platform in any capacity. This article is not intended to serve as a reference for making investment decisions.
You may also like
Five charts to help you understand: Where does the market go after each policy storm?
After this regulatory crackdown, is it a harbinger of an impending downturn, or the beginning of a new cycle where all negative news has been fully priced in? Let’s examine the trajectory after the storm through five key policy milestones.

Mars Morning News | The crypto market rebounds across the board, Bitcoin rises above $94,500; The "CLARITY Act" draft is expected to be released this week
The crypto market has fully rebounded, with bitcoin surpassing $94,500 and US crypto-related stocks rising across the board. The US Congress is advancing the CLARITY Act to regulate cryptocurrencies. The SEC chairman stated that many ICOs are not securities transactions. Whales are holding a large number of profitable ETH long positions. Summary generated by Mars AI. The accuracy and completeness of the content generated by the Mars AI model is still being iteratively updated.

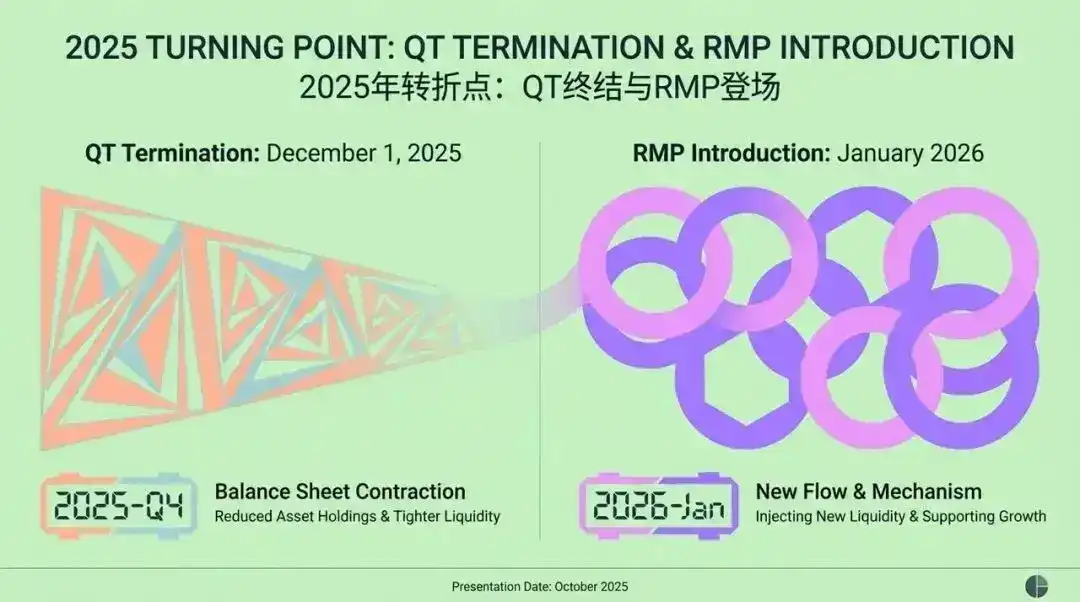
Federal Reserve’s Major Shift: From QT to RMP, How Will the Market Transform by 2026?
The article discusses the background, mechanism, and impact on financial markets of the Federal Reserve's introduction of the Reserve Management Purchases (RMP) strategy after ending Quantitative Tightening (QT) in 2025. RMP is regarded as a technical operation aimed at maintaining liquidity in the financial system, but the market interprets it as a covert easing policy. The article analyzes RMP's potential effects on risk assets, the regulatory framework, and fiscal policy, and provides strategic recommendations for institutional investors. Summary generated by Mars AI This summary was generated by the Mars AI model, and the accuracy and completeness of its content are still in the process of iterative improvement.
Rate Hike in Japan: Will Bitcoin Resist Better Than Expected?