Date: Sun, March 30, 2025 | 09:50 AM GMT
The cryptocurrency market is under renewed selling pressure, erasing recovery gains made earlier this week. Ethereum (ETH) has dropped over 8% in the past two days, falling below $1850 from the high of $2K.
But in the midst of this, Helium (HNT), the IoT token, has still managed to gain 6% today. With price action improving and technical indicators aligning, a potential recovery rally could be on the horizon as it has dropped by 50% in the last 90 days.
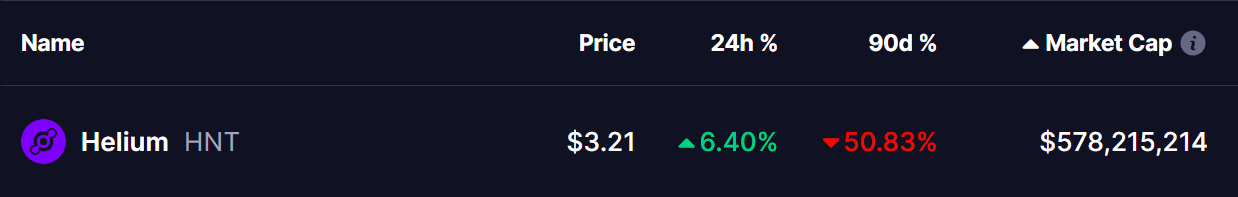 Source: Coinmarketcap
Testing Key MA Resistance
Looking at the daily chart, HNT has undergone a significant correction—over 75% since being rejected at the $10.00 resistance level on December 16, 2024. This bearish pressure dragged the price down to a critical support zone near $2.32, where buyers stepped in to hold the line.
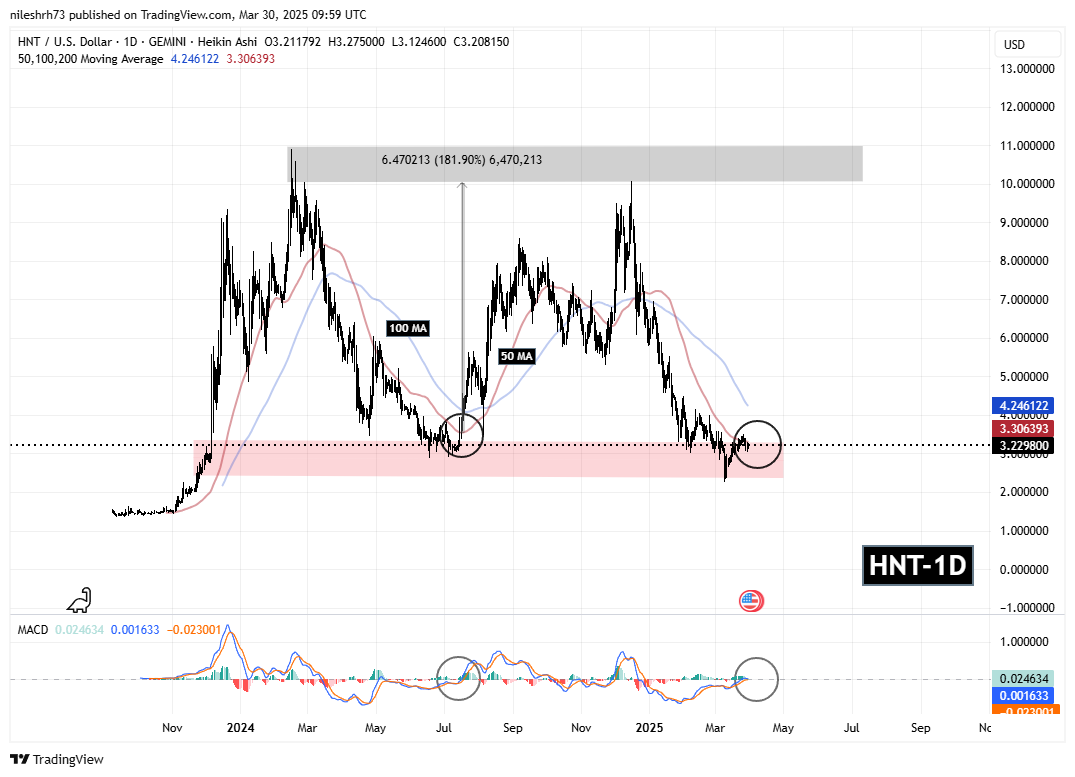 Helium (HNT) Daily Chart/Coinsprobe (Source: Tradingview)
HNT has now rebounded to $3.22 and is testing a key barrier—the 50-day Moving Average (MA), currently near $3.30. This level holds significant weight, as it has historically acted as a major pivot point.
Interestingly, a similar pattern played out in mid-2024, where HNT bounced from a support zone and broke above the 50-day MA. This led to an impressive 181% rally, pushing prices towards the $10.00 range again. The chart highlights this move clearly, with a massive rally following the breakout from the MA zone.
What’s Next for HNT?
Currently, HNT is forming a comparable technical setup. The price is once again rising from a major support region and testing the 50-day MA. If HNT manages to break and close convincingly above this level, it could signal a bullish reversal, potentially attracting fresh buying interest and fueling a rally.
Immediate resistance levels to watch post-breakout would be around $3.96, followed by the 100-day MA near $4.64. A move above both these levels could pave the way toward a more extended recovery phase.
Disclaimer: This article is for informational purposes only and not financial advice. Always conduct your own research before investing in cryptocurrencies.