XRP Price Shows Resilience: Holding Strong and Eyes Another Surge

XRP price remained in a positive zone above the $2.40 zone. The price is consolidating and might aim for a fresh increase above the $2.60 level.
- XRP price started a downside correction from the $2.65 resistance zone.
- The price is now trading above $2.40 and the 100-hourly Simple Moving Average.
- There is a key bullish trend line forming with support at $2.45 on the hourly chart of the XRP/USD pair (data source from Kraken).
- The pair might start another increase if it clears the $2.550 resistance.
XRP Price Holds Key Support
XRP price started another increase above the $2.40 resistance zone like Bitcoin and Ethereum . There was a move above the $2.50 and $2.55 levels.
However, the bears were active near $2.65. A high was formed at $2.64 and the price started a downside correction. There was a move below the $2.55 and $5.20 levels. The price dipped below the 23.6% Fib retracement level of the upward move from the $2.165 swing low to the $2.645 high.
The price is now trading above $2.40 and the 100-hourly Simple Moving Average. There is also a key bullish trend line forming with support at $2.45 on the hourly chart of the XRP/USD pair. The trend line is close to the 50% Fib retracement level of the upward move from the $2.165 swing low to the $2.645 high.
On the upside, the price might face resistance near the $2.50 level. The first major resistance is near the $2.550 level. The next resistance is at $2.650. A clear move above the $2.650 resistance might send the price toward the $2.750 resistance.
Source: XRPUSD on TradingView.comAny more gains might send the price toward the $2.850 resistance or even $2.920 in the near term. The next major hurdle for the bulls might be $3.00.
More Losses?
If XRP fails to clear the $2.550 resistance zone, it could start another decline. Initial support on the downside is near the $2.450 level. The next major support is near the $2.40 level.
If there is a downside break and a close below the $2.40 level, the price might continue to decline toward the $2.280 support. The next major support sits near the $2.150 zone.
Technical Indicators
Hourly MACD – The MACD for XRP/USD is now gaining pace in the bearish zone.
Hourly RSI (Relative Strength Index) – The RSI for XRP/USD is now below the 50 level.
Major Support Levels – $2.4000 and $2.3500.
Major Resistance Levels – $2.5000 and $2.6500.
Disclaimer: The content of this article solely reflects the author's opinion and does not represent the platform in any capacity. This article is not intended to serve as a reference for making investment decisions.
You may also like
Deep Reflection: I Wasted Eight Years in the Crypto Industry
In recent days, an article titled "I Wasted Eight Years in the Crypto Industry" has garnered over a million views and widespread resonance on Twitter, directly addressing the gambling nature and nihilistic tendencies of cryptocurrencies. ChainCatcher now translates this article for further discussion and exchange.

Altcoin ETFs are launching in droves, so why aren’t they driving up token prices?
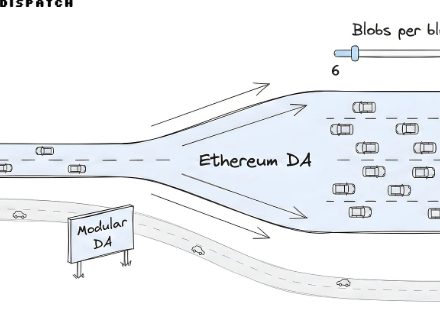
Ethereum's "DA Dawn": How the Fusaka Upgrade Could Make Celestia and Avail Seem "Redundant"?
The article discusses the concept of modular blockchains and Ethereum's performance improvement through the Fusaka upgrade. It analyzes the challenges faced by DA layers such as Celestia and highlights Ethereum's advantages. The summary was generated by Mars AI. The accuracy and completeness of this summary are still being iteratively updated.
Rising Bitcoin ‘liveliness’ indicator suggests bull market may continue: analysts